Investor Memo Feb 2023

Dear Investor,

In this memo we will do a review of the Q3 results of our portfolio companies and will also share our take on the markets.

Equity markets globally have been challenging since October 2021 and equity returns have been very meagre in the last 1.5 years or so. We had communicated last year in March that any sort of correction is always a good time to increase allocation to equity because outsized returns can only be made when investing is initiated, or allocation is increased during a phase of market correction or consolidation. It has been almost a year since then and markets continue to be difficult with no visible respite in macro headwinds. The Russia-Ukraine war still goes on and can possibly turn uglier, inflation has cooled a bit but continues to be sticky and high still, central banks are still hiking rates and the possibility of any reversal with a rate cut is very remote now.

However, we will stick with our advice that markets currently are offering an attractive point to increase allocation. Valuations have turned quite attractive, and we are finding much better investment opportunities compared to the start of 2022. Even in our portfolio, there are several companies that have delivered strong growth (portfolio performance discussed below) but their share prices are either flat or even have fallen in the last 1.5 years or so.  So, it makes sense to allocate more to equity now though we will be candid we have no clue of when there will be reversal in market trend or whether even the market has bottomed out. No one can time the market so there is no way to predict whether there will be further correction or the time frame in which markets will bounce back. But we are sure that when the market trend will reverse, the return from that point on will be significant. Equity returns do not come in a linear manner and the average long term ~13-14% CAGR of Indian indices have been delivered in a very volatile way if one looks closely at annual returns over the last 15-20 years.  

So, we will repeat our advice of increasing your allocation to equities to take advantage of the current market mood. We expect markets to remain tough over the next few months as macro challenges persist, so it is better not to expect any quick returns from here on. However, to handle the volatility, a good approach can be to invest whatever amounts one can one in a SIP manner during this volatile phase. The incremental allocation does not have to come in a large lumpsum. 

In this month’s update, we will be discussing the Q3FY23 (Oct-Dec 2022) and 9MFY23 (Apr-Dec 2022) performance of our portfolio. The table below shows the company wise performance. Depending on different factors like vintage of portfolio, valuations at which the portfolio companies were trading at, cash in portfolio, etc, different client portfolios will have different compositions.

Some highlights of the portfolio performance are:

  1. In 9MFY23, the median sales growth (yoy) and EPS growth of the portfolio companies were 23% and 15% respectively. In the latest quarter, i.e. Q3FY23, the corresponding figures were 17% and 19% respectively.

  2. The profit growth in 9MFY23 was substantially lower than sales growth due to inflation in commodity & energy prices, freight rates, etc as well as other supply bottlenecks like chip shortages in the auto sector. However, inflation seems to be subsiding as most portfolio companies reported improved profitability sequentially as is visible in higher profit growth than sales growth in Q3FY23.

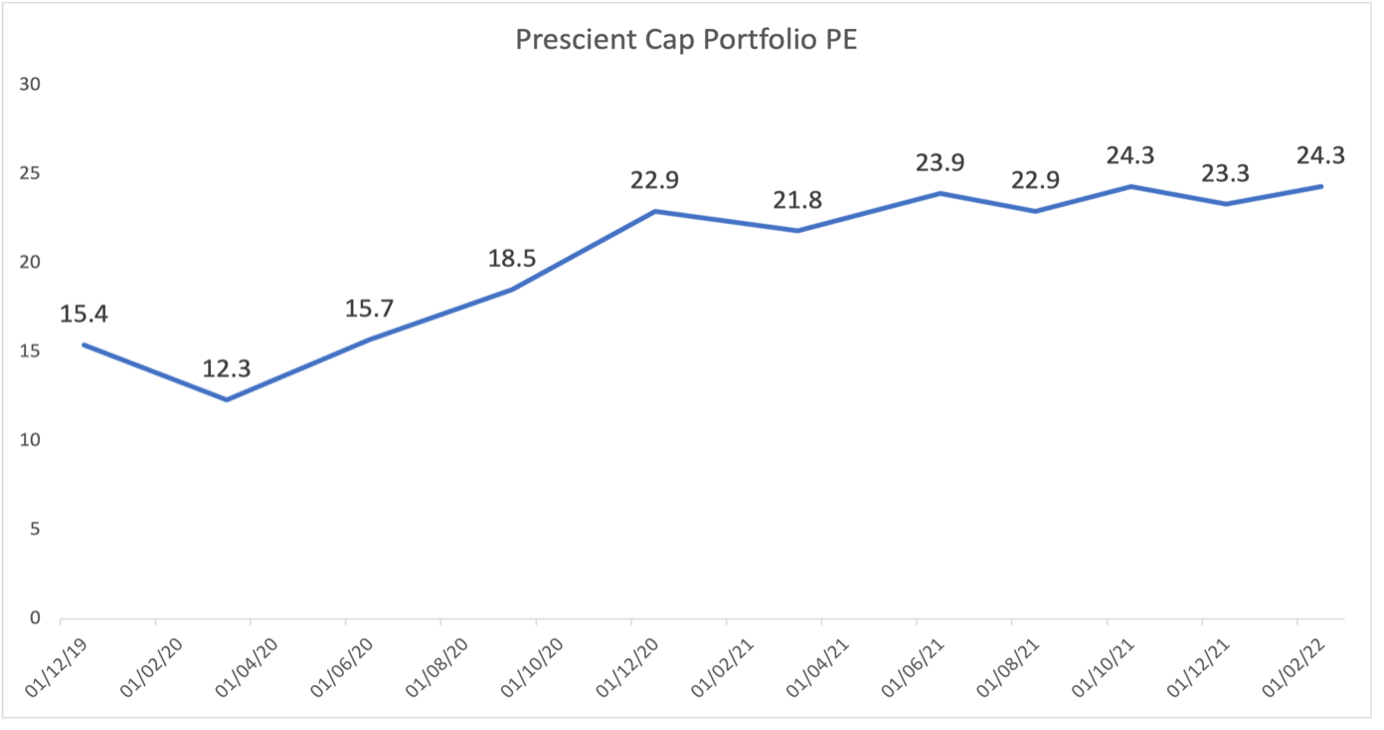
  3. The median P/E (ttm) and P/B (ttm) of the portfolio were 17.3 and 9.9 respectively. Our portfolio is trading cheaper at a 16% discount to the Nifty 500 index, which is trading at a P/E of 21.25.

  4. The balance sheet of our portfolio companies is very healthy with 13 out of 18 Non BFSI portfolio companies having net cash on books.

We continue to be bullish about selective sectors that we believe will continue to deliver strong growth despite macro challenges like:

  • Capital goods & engineering companies with globally competitive products

  • Auto ancillaries that are making products for the EV space

  • Cement companies with industry leading cost competitiveness 

  • Regional consumer plays that are increasing their distribution foot prints

  • Pharma companies with market leading Indian drug brands 

  • Banks / NBFCs with razor sharp focus on asset quality and creating a strong liability franchise

The key point we want to emphasise is that the portfolio performance in Q3FY23 was above our expectations for the majority of the companies. There were a few disappointments mainly Heranba Industries and Mangalam Cement that delivered poor results due to sectoral headwinds and company specific challenges. However, overall, the portfolio performance is satisfactory, and the portfolio is quite healthy with most companies having net cash on balance sheet and strong growth outlook.

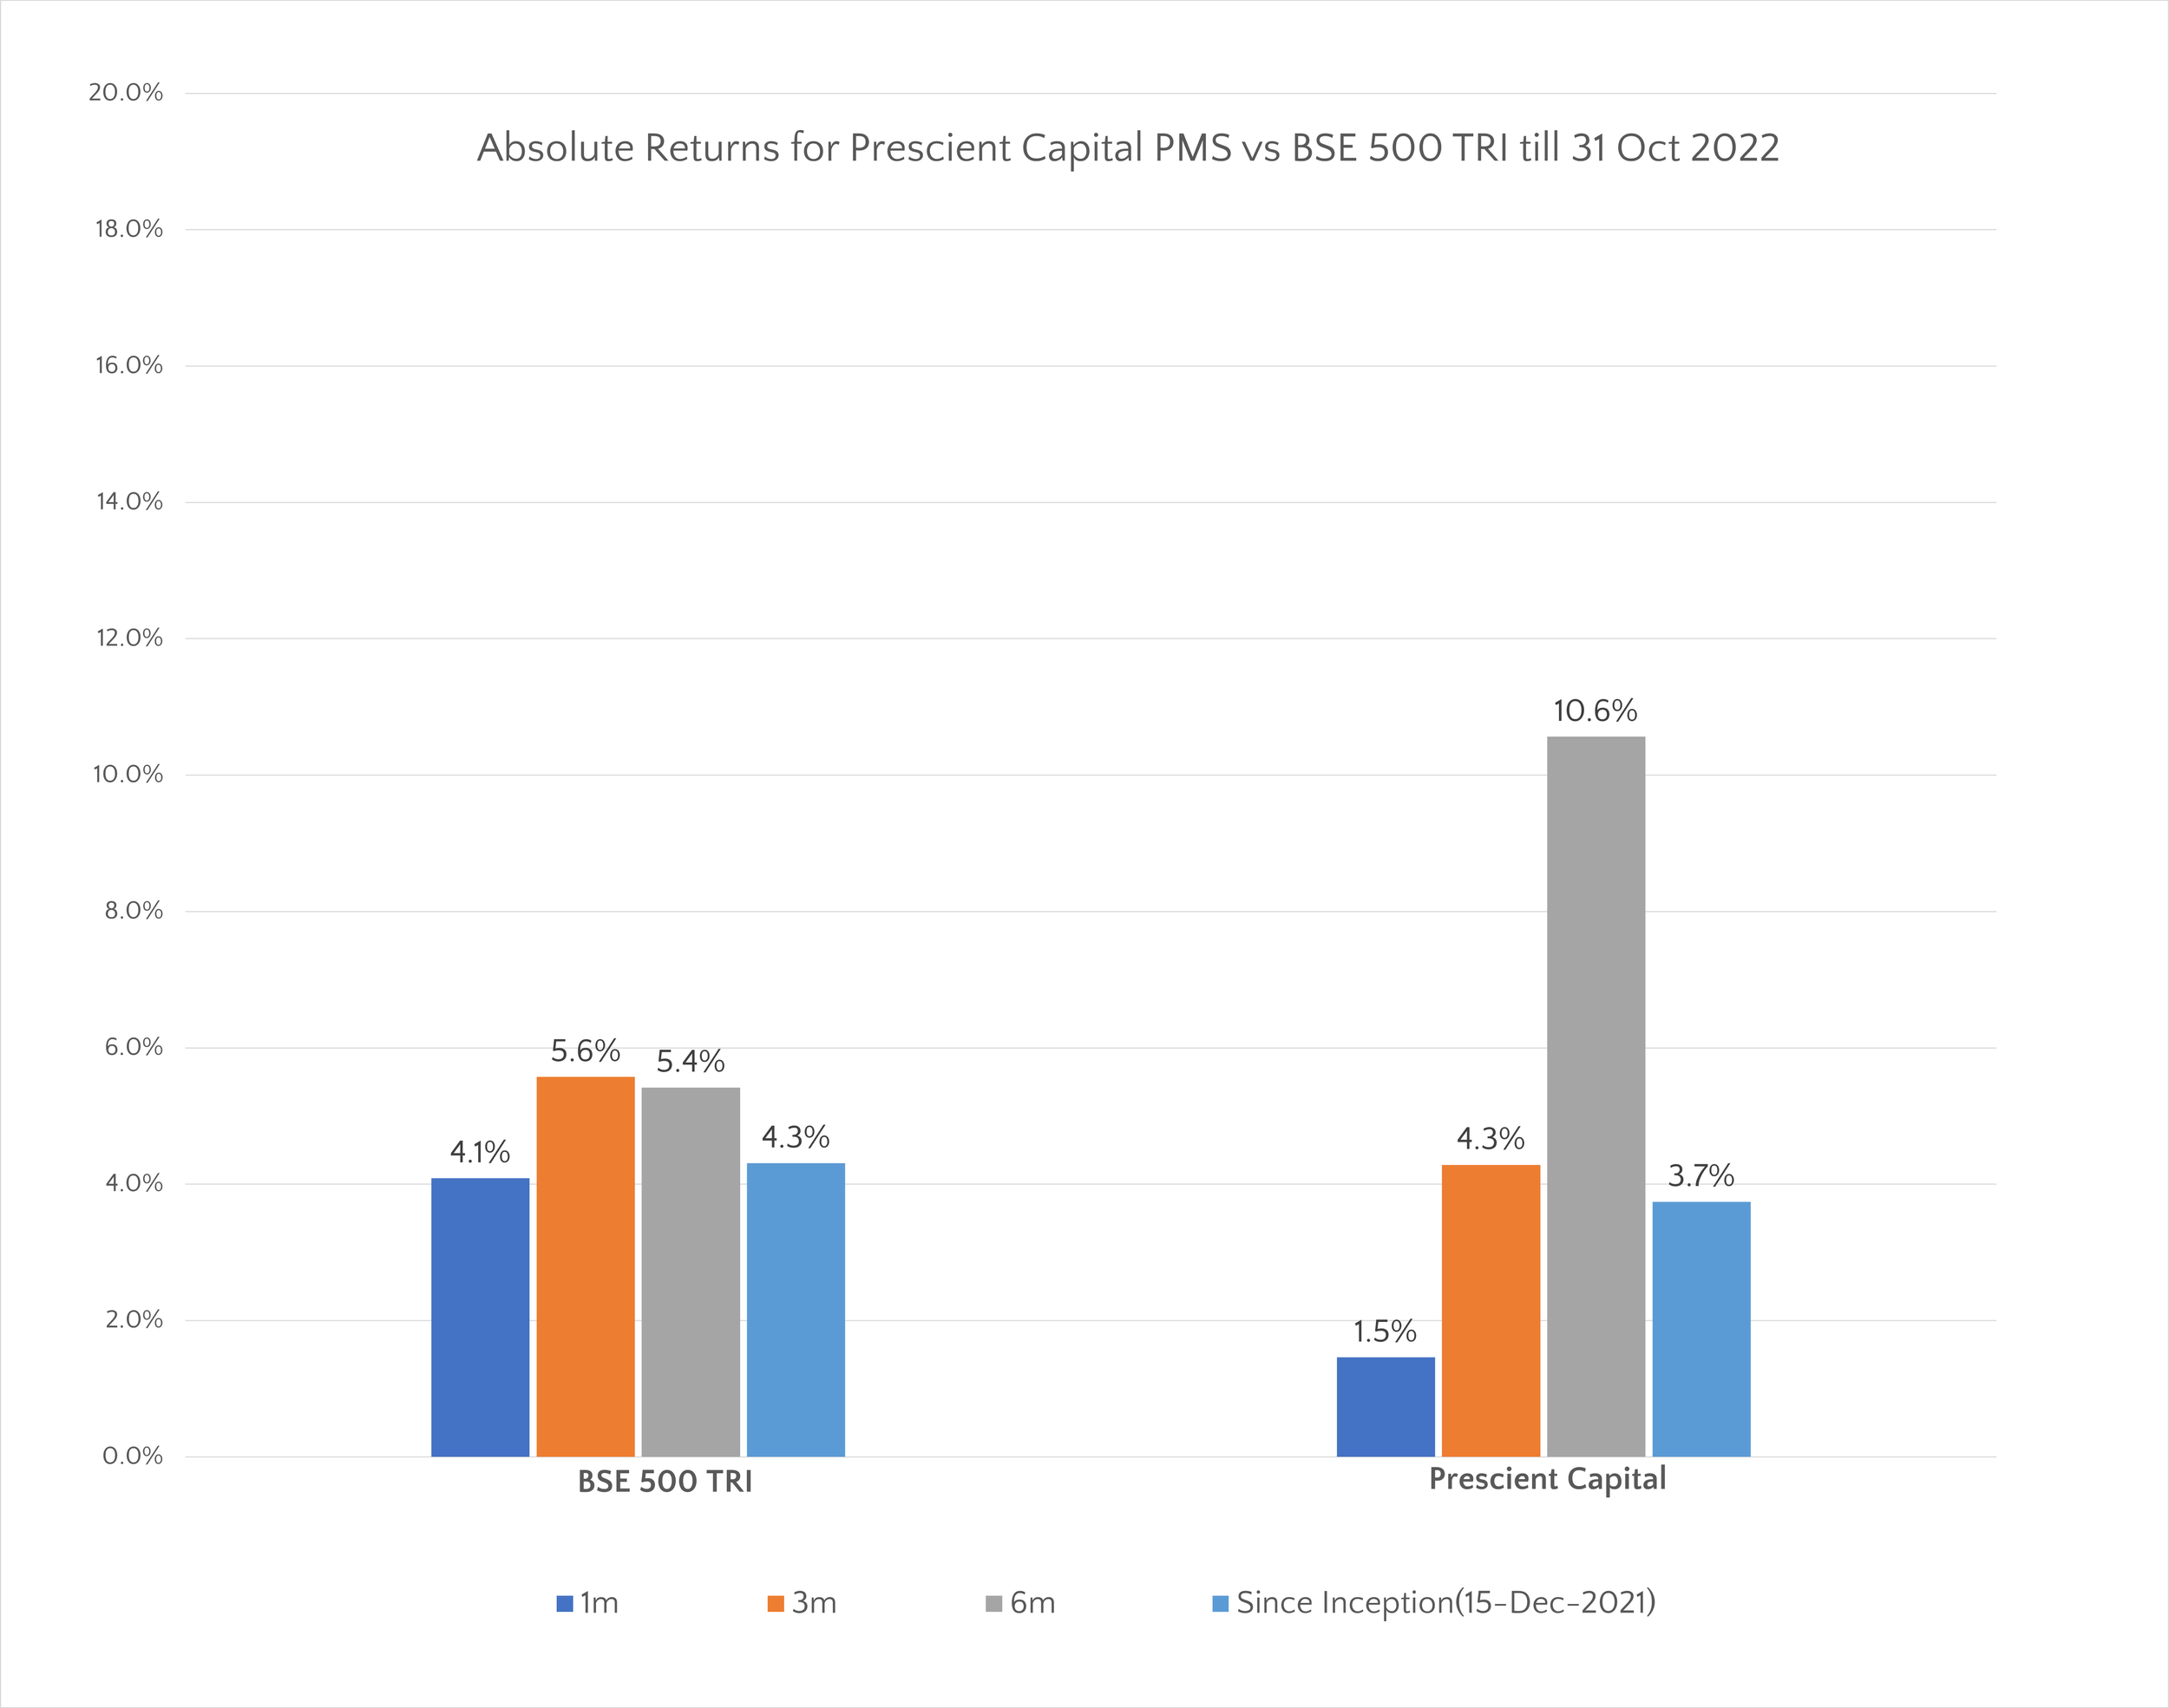
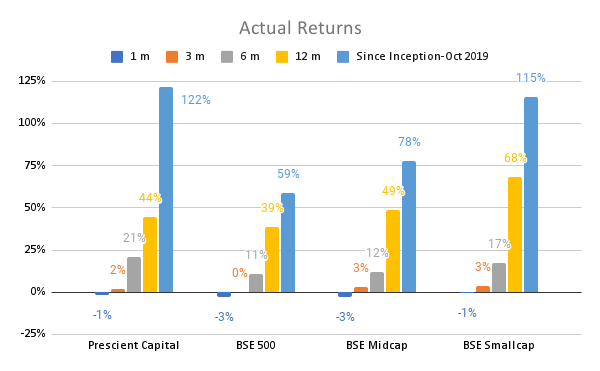
The market has been challenging since the start of 2022. We experienced that even those portfolio companies that beat expectation by a large margin in Q3FY23 did not witness any share price appreciation. While those companies that even slightly underperformed expectations have been punished severely. This is true not only for our portfolio companies but for the broader market in general and especially for small and mid-cap companies. The chart below compares our returns viz BSE 500 TRI index.

*This is a time weighted return for the overall PMS capital pool net of all fees and charges. This is not the return for a particular client. 

The markets can continue to remain challenging given most of the macros are negative whether it is inflation not subsiding as much as expected globally, possibility of higher than expected hikes in interest rates, Russia Ukraine war escalating further, etc. It is impossible for us to predict market direction and macros so we will remain focused on bottoms up factors like earnings performance, growth outlook, valuation and balance sheet strength of our portfolio companies. 

This is not to say that we will not be mindful of downward risks but that we will manage those by turning more conservative about valuations and by more stringent tracking of any challenges that our portfolio companies can face. We cannot predict when the markets will enter an upcycle, but our best efforts will be to minimise drawdown till we reach that stage. We will request you to remain patient through this difficult phase as you have been for the last year or so.

Please feel free to reach out if you have any questions or concerns.

Thanks & Regards

Prescient Capital

Investor Memo Jan 2023

Dear Investor,

Below chart depicts our performance viz the baseline index.  

A lot of you would have read or heard about the recent Hindenburg report on the Adani Group. In this memo, we wanted to draw a parallel from that report and write about why in investing a promoter’s corporate governance is more important than his/her business and/or its valuation. We at Prescient Capital follow the following framework, in that order: 

  1. Good/clean promoter

  2. Good business

  3. Good price 

Through our decade long journey in investing, we have seen that: 

  • The single largest source of value destruction in markets is a promoter with a chequered governance track record. 

  • Promoter quality is not a linear scale that can be priced in valuation. A lot of our peers think otherwise.

We typically end up investing in small and mid-cap companies which have low institutional shareholding as large institutions/MFs cannot build a sizable position without affecting the price. Third party diligence therefore doesn’t exist or is minimal. Whatever needs to be done is your own independent research. Our promoter research is a mix of both subjective/objective assessment.


In this memo we will try to lay out our promoter governance/evaluation framework which we think is quite robust. The framework has help us significantly reduce the odds of permanent loss of capital. 

Promoter/Promoter Group members salary 

The ministry of corporate affairs, lays down the maximum limit of remuneration that a Managing Director, Wholetime Directors of a company can together draw as 11% of PAT. Any increase in the absolute value of remuneration of Managing Director, Wholetime Directors should be approved in the AGM. We, however, adopt a more pragmatic commercial stand to the same, as many promoter families fill their middle management ranks with their family members. 

  • We believe that the sum total of salaries of all these family members should not exceed 5-7% of the PAT for that year. 

  • We have often seen red flags whereby a young son of a promoter with a mediocre education background is drawing a salary higher than a senior professional with greater than a decade of professional service experience. 

  • We also raise a reg flag if the salary of a promoter is low. We have come to learn that “less is bad”. A promoter who discloses and takes a flat high remuneration, is far better than the one who draws less and then finds ways to create leakages in the company. Leakages are in the form of movable assets, related party businesses, inducting more than reqd. family members, entering new businesses that match the promoter's lifestyle.

  • Same applies to the salaries of the key management. Less is bad. Will share an instance about an apparel company, in which the fund we previously worked at, invested in. The salary on the books for two senior business heads was very low. We were invited to a new EBO launch and to our surprise saw them both getting out of their own expensive luxury cars. When we casually enquired about the same with the promoter, the promoter in a sheepish manner, mentioned “They work hard, have given them cars to rest well during their commute!!”. We knew we had a lemon. We soon found out that the balance sheet of that company was completely fake.

  • We also investigate instances where the salary of a promoter/group is growing higher than the rate of growth of profit of the company. For instance, in 2017, Neeraj Kanwar, the MD of Apollo Tyres asked shareholders for a 43% raise in salary whereas the profits of the company declined by ~ 2%. The shareholders of the company rejected the salary raise and the promoters were forced to take a salary cut. The profits of the Apollo group in FY 2022, are still lower than those in FY 17 and FY 16.

  • Some promoter groups use buyback to get disproportionate pay out of their companies. The procedure for applying for a buyback is cumbersome for an individual investor and hence their allocation is sometimes unused. Some promoter groups participate in the buyback and get a preferential allocation of the shares not tendered.  Groups that use the buyback to their advantage, are a clear pass.

Auditors Remuneration & Diligence

  • Auditors remuneration is a key monitorable both in absolute terms and as a trend. We are not a big fan of Big 4 or Big 10 in the Indian context, but we question things like: How can an auditor audit a 1000 cr + topline company for 7 Lakh of fee? Sometimes, it just doesn’t add up. This is a huge problem we grapple with Pharma, Speciality Chemicals, Building Material and Consumer Durables Companies in India. The Auditor's salary just doesn’t add up. How can one audit a multi-location plant, sales, distribution set up having a 1500 cr plus topline in less than 25 Lakh? Not saying that these companies are bad, but one needs to find ways to get comfort that they are professionally managed. 

  • Speaking with auditors or someone in the team is a good thing to have. We remember speaking with the auditor of a leading bag company. We had called them to know about the promoters. To our surprise, the auditor told us that the company is involved in a VAT fraud.  

  • We also use our auditor/CA network to identify/meet companies respected in the CA community. 

Scanning for related parties: 

  • We typically find related party dealings more than 20% of the sales or purchase of materials as a red flag. On one hand, it diminishes the assumptions of MOAT of a business, on the other, as public market investors we do not have the wherewithal to question the fairness of the dealings event when audited by the Big 4. 

  • We have seen instances, where related party dealings in raw material purchase brings about volatility in margins. We prefer to stay away from such companies. In some cases, promoters take a loose approach and do not mention a competing business by a family member, as a related party. Such companies and groups are a big no. 

  • We also dig for other listed/unlisted promoter entities at the same registered address by looking at websites such as ZAUBA. In case, there is a web of these entities or they have dealings in politically sensitive sectors such as mining, infra, real estate, we stay away from that group. 

  • Some Promoter groups use their family members for key roles like procurement, HR, business development. We prefer to scrutinise these companies more as we understand it is quite easy to fake bills under a family member and syphon funds. 

  • Some promoter groups have inter-corporate deposits (ICDs) where they use cash-flows from one business to support the expansion of the other. The logic often given to minority shareholders is that ICDs will yield more coupon that a treasury yield and hence a win-win for both. In our experience, such groups rarely create value for minority shareholders. 

Hidden Liabilities & Receivables

  • It has been often seen that long term assets and liabilities are a way to brush current receivables and liabilities under the rug. Sectors such as EPC, construction, IT provide an opportunity for milestone-based revenue booking. Promoter groups often use the same to show lower receivables days and impress the investor community. 

  • Inventory write down/off practices in businesses such as apparel, building materials are a way to understand how professional/conservative a promoter is? We have often seen inventory not being written down aggressively to protect the projected profitability and value of assets of a business with shareholders and lenders respectively. Such businesses require one headwind, and the business suddenly turns to red from black.       

Business with government/industry bodies with poor credit history

We avoid companies working solely with the government, pseudo government bodies, and development agencies. Dealing with these bodies on social/health/infra projects is a complex task and has been seen to stretch the balance sheet of a company. We cannot quantify this risk and hence stay away from companies such as the Adani Group. 

Credit rating by rating agencies

  • Per us, CRISIL is the only rating agency in India that still does its job diligently. We have seen CRISIL downgrade a promoter group debt due to its inability to pay interest on time or pull back its assessment if the promoter group doesn’t cooperate in CRISILs diligence. 

  • The ultimate test of cash generation of any company is its ability to pay its liabilities (debt & interest) and shareholders (dividend/buyback). We have seen scenarios whereby on one side a company has a significant cash on its books but still delays payment of debt interest and/or principle. Such groups are a red flag. 

How distracted or disciplined is a founder

  • We started this as an informal exercise a decade back but soon realised that this is core. What we are digging for is “How distracted is the founder”. We use this for elimination, rather than for selection. For instance, the MD of a leading consumer durables company being a Lok Sabha MP is a red flag. Or the MD of a leading men apparel brand was more bothered about his silverware, planes, and snow cars than his plans to turnaround his business. 

  • We also look for expansion/acquisition into arguably not related areas. We made the mistake of investing in a gaming company knowing fully that gaming is a non-linear acquisitive business. The promoters of the business recently decided to buyout media companies producing gaming content and a gaming hardware/accessories company. The rationale given was to own the gaming ecosystem. The business has been dumped by most public market investors. 

  • Promoters who become dealers/brokers for their stocks by talking about share blocks need more diligence.  

  • We look for candour in annual disclosures. We look for behaviour whereby a promoter takes undue credit for a macro tailwind in a business and/or delays disclosure of bad news.  

  • Lastly, we are all for a company being run by a professional management. We, however, believe that a management just incentivised by salary/bonus is usually not aligned with the long-term sustainable growth of the company. We stay away from companies where promoters have given the day-to-day control of their business to a management and have not incentivised them by reasonable ESOPs. Such promoters are kept away from the reality of the business by their management.   

Look for events of shareholder wealth creation

  • This is a litmus test that is above all. Prior behaviour of founders to distribute cash reserves, not dilute minority shareholders, high dividend pay-out, not participate in buybacks, and no event of a preferential allotment are all very strong indicators of a good governance.  

  • Another event to measure the same is the terms of merger of a group entity. We do not like promoters who merge/de-merge group entities too often. If done too often, it is usually good only for founders. 

  • Also, a promoter who pledges his stake for equity infusion in another business is a big no. Usually such companies are not left with much chance and your wealth creation (already a low prob) is not aligned with that of the Promoters.  

Thanks 

Prescient Capital


Investor Memo Dec 2022

Dear Investor, 

Happy new year. Wishing you and your family great health and happiness. Below is the chart comparing our performance to the benchmark.  

In this update, we will examine whether timing the market can lead to better returns. The most common query we are posed by our prospective clients is whether it is a good time to invest given maybe the market is at an all time high. In fact, we have experienced that this is a question we are asked more often than other more relevant questions that prospective clients should ask of active fund managers like us: how our strategy is differentiated, how do we manage risk in our strategy, are we flexible to change our strategy in different market scenarios given no strategy works in all market scenarios, etc.  

We will be looking at historical data of the past 50 years of S&P 500 to check whether market timing can lead to better returns. We have chosen a US Index only because we don’t have 50 years trading history for Indian indices like Nifty 50 or BSE Sensex. Also, S&P 500 index is a more broad-based index and is thus a much better representation of overall market behaviour. 

We compare the returns generated when invested in S&P 500 on any day historically with 2 different scenarios:

  • Returns when someone invests in S&P 500 only on the days when it hits an all time high (ATH). Logically this sounds like a very risky strategy as investment is being done when markets (as represented by the index) are at an all time high. This will help answer whether an investor should wait to invest for markets to correct if it is hitting an all time high. A most common question posed to us as we noted above.

  • Returns when someone invests in S&P 500 on the days when it has corrected 20% from its previous all time high level. Logically this sounds like a safe strategy as investment is being done when the market has entered a bear phase. A correction of 20% from previous high is considered as the market entering a bear phase. So, investing at bear market levels should logically offer better than average risk reward pay off.

Below is the chart of S&P 500 index over last 50 years:

First, we look at the statistics of 1 year, 3 years and 5 years returns (CAGR in case of greater than 1 year holding period) generated if we invested on any day in S&P 500 over the last 50 years.  There were 12,607 trading days of S&P 500 over the last 50 years period ending on 23rd Dec 2022. We calculated the 1 year, 3 years and 5 years returns generated if we invested on each of the 12,607 days. Below is the distribution of 1 year returns in a chart form as well as different statistics like mean, probabilities, etc for the set of 1 year, 3 years and 5 years returns in a tabular form.

*when holding period is > 1 year, return means CAGR generated wherever mentioned in table

Now we will look at the statistics of returns generated when an investor invests only on days when the S&P 500 hits an all-time high. There were 864 such days in the last 50 years of trading history of S&P 500 thus the set of samples is obviously smaller compared to the above analysis. Below is the distribution of 1 year returns in a chart form as well as different statistics like mean, probabilities, etc for the set of 1 year, 3 years and 5 years return in a tabular form for this analysis.

*when holding period is > 1 year, return means CAGR generated wherever mentioned in table

There is hardly any difference in the statistics in the above table compared to the statistics in the table when investing was done on each trading day in S&P.  The median 1 year, 3 year and 5 year returns are almost the same. Moreover, the probabilities of loss in capital invested (-ve returns) and of generating 10% or higher annual returns is almost similar to if one invested on any given day in S&P 500. The only difference is that the min, max returns as well as the volatility of returns (as measured by standard deviation) in this case are lower than if we invested on any given day in S&P 500. This we guess is a positive trait as it indicates lower volatility.  

The results seem to be contradicting our intuition that returns should be significantly lower if one invests in equities when the market (as represented by a benchmark index) is at an all time high. There are couple of reasons for this:

A.) Bull markets last much longer, typically 5-6 years, than bear markets, typically 1.5-2 years. If we just take a look at the 50 years chart of S&P 500, we can see bull cycles:

  • From 1991-2000 till it ended with the dotcom bust

  • From 2003-2007 till it ended with the Lehman crisis 

  • From 2009-2021 end with a very minor (time wise) blip related to the coronavirus pandemic scare lasting only ~6 months or so over March to October 2020

So, if one stays away from the market when it hits an all ATM, specially in early days of a bull cycle, he/she will find it most difficult to get in at a later stage due to anchoring bias and may miss the entire cycle. An important question to consider is how does one know when the market starts to hit an all-time high that it is not the start of a multiyear bull cycle?

B.) Indices or particular equities only hit a high typically when macros are positive, earnings growth prospect is strong, etc. Most often this confluence of positive factors remain in place for a while till some macro turns negative or in case of a particular stock if there is a major misstep by the company. So, it makes sense that when the index hits an all time high, there is a good probability it will keep on hitting further highs for a while. A very popular and proven technical style of investing - ‘momentum’ investing is based on investing in stocks when they hit an all-time high. There are active fund managers who have used this strategy to deliver attractive returns.

We are fundamental bottoms up investor and do not use any technical style but even for us, our greatest winners like TD Power, FIEM Industries, etc have kept on making new highs over time and contributed the most to our returns. We first started investing in FIEM at INR ~400 level and in TD Power at around INR ~25 level for our oldest clients. Subsequently we kept on averaging up both of these 2 stocks in older portfolios as well as bought these at different higher levels in new clients. In fact, we are still investing in both these companies at current levels or at slight discount for our new clients as well as averaging up in older portfolios. A very important point to remember is how a stock or overall market has reached a particular level is irrelevant. If it makes sense to invest from a bottom up perspective due to attractive valuation and strong earnings prospects, then one should obviously invest rather than hoping and waiting for a better entry point.

The last analysis we will do is evaluate whether investing only on days when S&P 500 corrected 20% or higher from previous high is an attractive investing scenario. Below is the distribution of 1 year returns in a chart form as well as different statistics like mean, probabilities, etc for the set of 1 year, 3 years and 5 years returns in a tabular form for this analysis.

*when holding period is > 1 year, return means CAGR generated wherever mentioned in table

Comparing the results from this scenario with the above 2 scenarios, one thing which is clearly different is that the probability of -ve returns or basically dip in capital invested reduces substantially. This makes sense because if one invests after the index is already down 20%, then chances of losing money from that point is significantly lower. Other parameters like median return and probability of generating 10% or higher annual return are almost similar to the above 2 scenarios. So, one can conclude a 20% or higher correction offers better than average risk reward payoff as risk of capital loss is lower.

Overall, our conclusion from the above historical analysis is that it does not make sense to wait for a correction to invest when markets are at an all time high or in general post a period of good returns. However, on the other side, market correction by 20% or higher from a previous high offers a better than average risk reward payoff.

Please let us know if you have any questions / concerns.

Thanks 

Prescient Capital

Investor Memo Nov 2022

Dear Investor, 

Hope you are doing well. Below is a chart depicting our returns viz BSE 500.

In this monthly update we will discuss the following: 

  1. Our current portfolio construct and the rationale for the same

  2. The valuation of our portfolio viz the BSE 500

  3. Performance of our portfolio companies in Sept 2022 and their near term outlook

Portfolio Construct

The chart below depicts the current construct of our portfolio. Your individual pie chart may vary based on your vintage with us. 

We have a high allocation to: Auto/Auto ancillary, BFSI, Branded Consumer goods and Manufacturing. These are four segments where we have deployed ~ 65% of your capital. Our core investment thesis in these 4 segments is as follows: 

Auto/Auto Ancillary

The auto industry is coming out of a 4-5 year period of demand contraction/stagnation. We are now seeing: a.) strong sustainable demand for passenger vehicles, refer chart below b.) steep rise in adoption of 2 & 3W EVs, c.) cyclical revival for commercial vehicles, d.) easing of supply side bottlenecks like semiconductor shortages. We are currently investing in OEMs which are segment leaders or in ancillary vendors of these OEMs. 

Source: SIAM, Vahan Dashboard

BFSI

The BFSI industry has weathered the COVID asset quality storm reasonably well. With rising interest rates and a strong demand across all segments of lending: housing, personal, corporate, MSME, vehicle and micro-finance (in that order) are segments we are interested in. We have been tracking the most conservative/high quality managements in each segment and building our position at reasonable valuations. A lot of research reports have been written about strong demand in BFSI and one should be less concerned about asset quality as the same will improve for the sector as a whole. There is a temptation to pick an asset at dirt cheap valuation as the whole sector will do good as a whole. We have however, seen that the culture of conservative lending is like reputation/trust: takes long but evaporates with one mistake. We therefore like to back only the best quality lenders at a reasonable valuation. Building a position at a reasonable valuation is possible only by investing in a sector before it becomes a hot sector.  

Branded Consumer

Core demand for consumer goods remains subdued due to either the high base effect of COVID or steep price rises taken to pass on inflation in prices of commodities. We have been investing behind players who are a.) breaking out from being small/regional players to multi region players, b.) Or are dominant players in their core verticals and are expanding into adjacent verticals. This thesis is playing out well, given that in the last 10 years FMCG distribution has been democratised. 

Manufacturing

Leading sectors in India: power, tyres, cement, pharma and chemicals are currently investing in expanding capacity and/or optimising their energy consumption. Refer to the Gross Fixed Capital Formation chart given below. The Russian-Ukraine war has also triggered discussions of energy self reliance around Europe. Indian companies which are globally competitive in manufacturing of power equipment are expected to gain from this trend. 

NOTE: Figures in INR Bn.

Portfolio PE Multiple and Performance

We are comfortable with our Portfolio’s PE multiple. We however have become cautious in the deployment of fresh capital given the background of rising markets. The current cash balance of ~ 12% on average is an indicator of the pace of deployment. 

Q2 FY 23 was a tough quarter due to rising input/fuel costs and weakness of demand in some pockets and high volatility in global currencies. 

  1. In Q2 FY23, our portfolio as a whole grew sales and profit by 18.8% and 17.5% y-o-y respectively. 

  2. 20% of our portfolio companies demonstrated subpar topline growth (less than 5% sales growth YoY). 40% of our portfolio companies de-grew their profits YoY in Q2 FY 23.  

  3. We are closely watching these companies for their near term outlook and building subsequent positions accordingly. 

  4. In situations like these, we focus on the metrics that are under the control of the management and eliminate short term blips due to external factors such as freight/supply shocks/currency/fuel as these external factors reverse equally fast.   

  5. We are already seeing commodity/metal prices and currency fluctuations taper.

  6. The balance 60% of the portfolio demonstrated a median sales and profit growth of 24% and 32% respectively. 

  7. We continue to allocate more capital towards names that can deliver a sustainable IRR of ~ 25% for the next 3 years. 

  8. We continue to find opportunities at reasonable valuation in Cement, BFSI, Auto Ancillary and Domestic Pharma.   

We have exited from R systems due to its sale and delisting from the exchanges. We believe that we can deploy the capital in other interesting ideas.

Thanks 

Prescient Capital

Investor Memo Oct 2022

Dear Investor, 
Hope you are doing well. Below is the chart depicting our Portfolio returns viz. BSE 500.

In this month’s memo we compare active and passive investing: 

As an investor, a very pertinent question for you to ask is whether it makes sense to just invest in passive strategies, basically index funds, rather than invest in active strategies like us (bottom-up stock picking). This is also an important existential question for us because an active fund management career for us only makes sense if we can beat benchmark indices sustainably. We do believe that sound stock selection can generate significant alpha over long investment horizons in case of Indian equities. However, the belief needs to be supported by some historical analysis so in this update we will evaluate whether an active investing style works in Indian equities or not.

This debate of active vs passive is a hot topic in US equities investing because most active strategies have not beaten benchmark indices like S&P 500 in the last 10-15 years. Given the higher fee structure of active funds, this has led to massive outflow of funds from active strategies into passive index tracking funds in the US. Also, the common perception is that equity investing, especially investing in small cap companies, is very risky and leads to losses. This is highlighted by the graphic below that was part of a recent article in financial daily Mint about the perils of small cap investing. It highlighted the fact that only 12% of small cap companies in India delivered more than 25% CAGR over the past 5 years and 14% of these companies die (get delisted or have trading suspended) over the same period.

Given what has happened in the US and the low probability of hitting upon a multibagger stock idea, one would think active strategies do not deliver alpha in India as well. In India, most of the public market funds are invested in active strategies so it makes sense to check whether historical data supports active investing in case of Indian equities. The table below compares the performance of Indian MFs against relevant benchmark indices over the last 10 years. We have chosen a period of 10 years as equities by nature is a long-term investment tool.

The data above clearly shows that Indian active fund managers have beaten benchmarks handsomely over the last decade. In case of all market cap-based categories of MFs, the median return CAGR is similar or better than the return CAGR delivered by the relevant benchmark index. The top performing fund has comprehensively beaten the benchmark returns while the return CAGR delivered by the top 20th percentile fund has also beaten the benchmark by a decent margin. The outperformance of active fund managers over benchmark is most pronounced in the case of the small cap category. In the small cap category, even the median return CAGR of small cap funds is ~500 bps higher than the return CAGR delivered by the benchmark. So how does one explain the dichotomy between these 2 facts:

  • Small cap companies have high mortality and low chance of success

  • Small cap MFs have generated the highest absolute returns as well as the highest alpha on average over the relevant benchmark

Apart from the above issue, another thing to consider is why has active management worked well in India over the past 10-15 years and failed in the US over the same period. We think there are a couple of reasons why active investing, basically stock picking, has worked especially in case of small cap companies in India:

High promoter ownership and lack of activist investors in Indian equities

Indian equities, except those in the banking sector, across market caps have high promoter ownership. This is in stark contrast to US equities in which typically institutions are the majority shareholders. This makes it extremely difficult to replace promoters and take control of the board in case of Indian listed companies. In addition to that, investor activism is low in India, and it is only in the past few years that there have been cases that minority shareholders have rallied together to oppose promoter mismanagement like unreasonably high compensation, totally unrelated diversifications, or acquisitions. There is no active investor in India of the stature of Carl Icahn, Dan Loeb, Paul Singer, etc in Indian investing. The low investor activism in India has both pros and cons for stock picking. On the one hand, there are many cases of obnoxious corporate misgovernance in Indian listed companies, especially mid and small cap companies that have even low institutional ownership. This leads to high mortality or poor returns in these companies, but these can be easily avoided by stock pickers who do a basic due diligence on promoter integrity. While on the other hand, there are many cases of market inefficiencies, again mostly in small and mid-cap companies, resulting in deep undervaluation. These are well run businesses but ridiculously underpriced compared to the value of their underlying assets and investments due to varied reasons like industry downcycle, low institutional interest, etc. In the US, such inefficiencies are quickly exploited by activist investors but in India these persist over considerable time periods. Such opportunities offer patient stock pickers to invest and wait patiently for any trigger to unlock the underlying value.   

Business scale needed to get listed in India much lower than in US or China

The scale of business needed for a company to get listed in India has always been much lower than in China or the US. This has historically been the case as there are some ~2,900 companies with revenue of less than 500 Cr (<100 Mn $) out of total ~5,000 listed companies in India (a share of ~60%). The latest company to get listed “Tracxn Technologies Ltd.” had FY22 revenue of INR 63.4 Cr (<10 Mn $). A company of this scale will find it impossible to get listed in the US or China. So, the small scale of most of the listed companies explains the dichotomy in small cap investing that we covered earlier. On one hand, it is natural for many such small businesses to find it very difficult to scale or even survive over time resulting in low probability of small cap companies to be multi baggers. On the other hand, there are many niche small businesses with differentiated models that offer active investors to find venture-like return opportunities with much lower than venture risk. In the small cap space, there are many companies operating in niche areas in industries like pharma, chemicals, consumer, engineering, etc that can scale rapidly just like any tech businesses that are funded by VCs on the private side in India. Below are 2 such examples:

Astral Ltd.

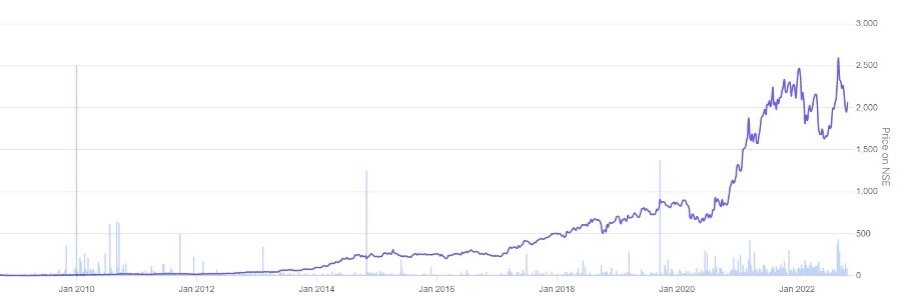
Astral was a small cap company with a market cap of just 219 Cr on 1st Jan 2010 and today its market cap is 41,730 Cr, which is same as that of Paytm today. It has delivered a 191x return over the last ~13 years or so. It is a very differentiated business started by first time entrepreneur Mr. Sandeep Engineer. Astral pioneered the branding of housing plastic (PVC & CPVC) pipes. You might have seen Salman Khan appearing in Astral Pipes ads on TV. No one thought that something as commoditized as plastic pipes could be branded and made into an aspirational product for homeowners. Astral was able to do that over the past 2 decades and the result is its multibillion $ market cap.

P I Industries Ltd.

PI Industries had a market cap of 269 Cr on 1st Jan 2010 and today it has a market cap of 49,506 Cr delivering a return of 184x over this period. PI pioneered the business model of outsourced manufacturing for global agrochemical innovator giants like Bayer, Dow, Syngenta, etc. 

There are many more such examples of companies from the small cap space that have scaled up to be multibillion $ market companies. So, there clearly are venture like investment return opportunities in the small cap space in India. However, the risk is much lower than in the venture space because these companies do not have easy access to capital like in the VC space in India. These companies have to use their accrued cash from business to scale, so these companies must be viable / profitable first and then scale using these internal accruals over time. Public market investors like us have the luxury to selectively pick viable and in fact most profitable businesses using simple financial metrics like high ROE / low leverage / lean WC cycle, etc to filter companies. It is relatively easier to cull out poor businesses that will most probably die or generate subpar returns than in venture area where even businesses with multibillion $ valuation are yet to prove their business viability. Thus, the large number of small and mid-cap listed businesses and the associated probability of errors of commission can be minimised by basic research on business fundamentals and management competence. The main analysis that needs to be done is whether these businesses have the right management, processes, business differentiation, etc to scale up and deliver outsized returns. Obviously there will be several cases in which the thesis on growth and scale up may not work out as in the initial investment hypothesis. However, we believe the downside risk of permanent capital loss or subpar returns is much lower in listed small and mid-cap listed space compared to venture capital, but the upside or rewards are almost similar.

The thesis shared above in support of stock selection in Indian equities, especially in the small and mid-cap space, is obviously biased by our strong belief that sound stock selection in Indian equities can lead to alpha generation. This makes sense as we need to be optimistic about the asset class and stock picking that we do and we hope we will be able to deliver healthy absolute returns for our clients.


Thanks

Prescient Capital

Investor Memo Sept 2022

Dear Investor, 

Hope you are doing well. The following chart depicts our returns compared to BSE 500 TRI benchmark

We wanted to start this month’s memo by drawing inspiration from the memo of Legendary investor Howard Marks. The memo is titled after his memo “Nobody Knows”. His memo was written during the peak of the COVID crisis, the message and where we are however is apt for the current context. I wanted to start this memo with a kind of a rhetorical question: 

Did we correct anything post the 2008 crisis or was it a debt patch work? The signs of the current crisis were loud and clear in 2018. The zero interest rate regimes and spends backed by more Debt, just made sure that the problem got magnified. India and Germany to an extent are the only two exceptions amongst large economies where the fiscal debt has been controlled. Refer chart below: 

Refer to our 2019 note: “Burn Baby Burn”, “Burn More” — Prescient Capital for a read of the situation in 2019, pre-pandemic. The COVID liquidity package just delayed the downward trigger by 2 years and made the problem even bigger. 

In the midst of all this global macro-economic chaos, a lot of you may have asked this question: Is India insulated from these events? Surprisingly, India has so far weathered the storm well and the Rupee hasn’t moved south much when compared to other leading currencies of the world. This however, is a static view as the global macros can deteriorate even further. The US, Europe and China (that constitute ~ 80% of global GDP) are slowing down and have a significant Fiscal debt overhang. Nobody knows or can predict the impact of the same on India and its equity markets. It is also not worth spending time to assess the same as the effort is best spent elsewhere. India will slow-down due to rising interest rates that directly affect spend on housing, automobiles and brown goods. The rise in prices to pass commodity inflation has also delayed/postponed the demand. Brands are working hard to pass on the high price inventory and re-kindle this demand. On the flip side, commodity and energy prices have cooled off and are likely to help in improving corporate profits. We have also seen corporate India spend heavily on CAPEX to address both domestic and export demand. All this implies that investing from hereon will not be based on macro/secular trends/momentum. We believe that bottoms up investing is key for making and preserving returns for the next 18-24 months.  

How are we spending our time: We are focusing on the companies in our portfolio, assessing them for the impact of a global slowdown, and re-evaluate their inclusion in the portfolio. Over the last 6 months, we have taken the following actions:  

  • Moved out of US focused drug formulations/intermediate companies due to a significant competition and price erosion and now the risk of slowing demand.  

  • Moved out of our IT sector bets where the trade-off between future growth and valuation was not in our favour. As we see things right now, the IT sector is slowing down due to a global slowdown. The IT sector may grow at a lower rate, and hence the valuations have to correct further for the sector to be investable. 

  • Domestic demand is expected to accelerate post the commodity cooldown. We have invested more in companies that have a domestic consumption play: Domestic Branded Pharma, Consumer Staples, Branded building material. 

  • We have invested in auto and auto ancillaries due to strong growth prospects in domestic Passenger vehicles and 2w EVs. We have capped our position in auto-ancillaries that are exporting or are evaluating them carefully QoQ for sustainable growth.

  • Increased allocation in BFSI across retail and commercial vehicle finance. We had to exit and limit our drawdown in a leading housing finance company after its MD put in his papers. We may invest more in regional banks/NBFCs investing in secured assets such as gold and working capital. We see revival in rural demand through the Microfinance route too. We however plan to stay away from MFIs as the risk reward is never in the investors favour.  

  • We have added companies in manufacturing that have a dominant client base/order book in India.  

  • Sectors where we plan to deploy more capital in the next 1-3 months: domestic demand based manufacturing, domestic pharma, FMCG and BFSI. 

We believe that the next 12-18 months will see high volatility in equity markets. There may be multiple rallies and multiple troughs. We plan to exit richly valued companies during these rallies and deploy aggressively during these corrections. We believe that times of uncertainty are best for returns in equity markets. Hence, if you have long term capital that you wish to deploy, this may be a good time.       

We want to end this memo with a quote from Howard Marks: “Waiting for the bottom is folly. What, then, should be the investor’s criteria? The answer’s simple: if something’s cheap based on the relationship between price & intrinsic value you should buy and if it cheapens further, you should buy more”. 

Thanks 

Prescient Capital

What are five key things to keep in mind for successful long-term investing

Stop chasing after each short term trend or fad in the market.

Generating healthy returns by investing in every new fad or hot sector and continuous portfolio churn without true understanding of fundamentals is impossible. Only deep understanding of sectors and businesses developed after thorough research & diligence and then patiently remaining invested in good quality businesses and management teams can lead to outsized investing returns.

Learn to endure market volatility and short term corrections.

Markets will be volatile driven by fluctuating investor sentiments, liquidity, FII inflows, etc. All factors over which businesses have no control but which impact their share prices in short term. Moreover, given how volatile macros are, businesses will face short term challenges like rising inflation, blips in demand, irrational competition, etc from time to time. If the businesses one is invested in are inherently high quality businesses run by honest and competent managements then they will overcome short term challenges to deliver industry beating performance in long term and outsized returns. One has to endure short term volatility and corrections to enjoy the long term outsized returns delivered by exceptional companies.

When investing in any opportunity, form a clear investment hypothesis and identify key operating and financial metrics to track whether one's ingoing thesis is working out or not.

For example, you may invest in a business with the thesis that its RoE (return on equity) will increase substantially during your investment horizon and so it will rerate and deliver great returns. For that to happen, some operating metric(s) has/have to improve like working capital should reduce or utilisation should go up or product mix should improve leading to higher profitability during our holding period. So, one has to identify the metrics at time of initial investment and then track their progress over time. Obviously one should be patient and give the company appropriate time to improve that metric. However, if one sees that there is no measurable improvement in that metric even after remaining invested for ample time, then one should exit or reduce the size of that position. On the other hand, if there is better than expected improvement in the identified metrics, then one should increase investment in such positions. It is important to double down on winning investments and cut down on losing positions over time to generate outsized returns.

Stop benchmarking you returns with other investors or indices or other benchmarks constantly.

While one should definitely benchmark longer term returns like over 2 years or longer, it is detrimental to compare 1 month, 3 months or even 1 year returns. Equity investing is meant only for long term as short term factors like volatility, liquidity, etc cancel out and only the business performance matters for delivering returns. So, one should be patient enough to allow an investment strategy to work out. Moreover, no investment strategy will work out in every market conditions. Every strategy is bound to underperform in different short periods of term. However, if the strategy is a sound one it will deliver healthy long term returns. So, one should avoid constantly benchmarking equity returns and be patiently invested.

Keep track of regulatory and technological disruptions that can structurally impair the fundamentals of any business.

While it is important not to be bothered by short term factors, it is equally important to keep track of any structural change like regulatory disruption or technological obsolescence or permanent shift in consumer preferences that can permanently damage a business’s fundamentals. If that happens, it is important to exit that position immediately.

Refer our article: https://www.zeebiz.com/market-news/news-what-are-five-key-things-to-keep-in-mind-for-successful-long-term-investing-analyst-decodes-196146

How can one avoid the odds of permanent loss of capital in markets?

Never loose capital, no other rule counts. As institutional investors, we have typically seen that there exists an information asymmetry between institutional and retail investors. Retail investors have limited access to quality research and to add the intermediaries that serve them sometimes do not have their incentives aligned. Retail investors therefore are left with no option but to: 1. Either buy a stock at expensive valuations, 2. Invest in momentum behind a stock, 3. Or are caught off-guard when a management ill-treats minority shareholders. All these actions greatly increase the odds of a permanent loss of capital. We believe that the golden rule of investing is never loose capital, and all other rules comes afterward.


The following tools/framework can help a retail investors and anyone in general to reduce the odds of loss of capital:

Quality of a Management: In our discussions with a lot of retail investors, we have seen than what is often not in public knowledge is the quality/ethics of a management. Life would have been much simpler if we could tag a management as red/yellow/green based on their governance practices. Investors could however, use the following thumb rules (list is not comprehensive) to safe-guard themselves from corrupt/low quality managements:   

  • Look for related party transactions in the annual report & stay away from managements that have either >20% of their sales or cost related to a group entity.

  • Stay away from companies that do not declare dividends/buybacks even though there is cash sitting on the books.

  • If total promoter remuneration/perks are greater that 2-3% of the top-line, it is a red flag.

  • If a company’s cash flow from operations is less than 50% of the PAT for the last 3-5 year period, such businesses are not attractive as they cannot recover their sales and capital gets stuck in working capital.

  • Stay away from turnaround and/or managements that are acquisitive. These have a very low probability of success even with a good management.


Quality of a business: Try to find companies that have a return on equity (ROE) > 15% for a 5-10 year period. Statistically speaking, companies that have a ROE >15% in the last 5-10 years, have compounded capital at a higher rate than the companies that have a sub-par ROE. Refer table below:

We can see from data mentioned above that investing in high quality businesses greatly reduced the odds of a permanent loss of capital to less than 2%.  

Pay a conservative valuation: Retail investors investing in a mutual fund or a PMS should always check for its trailing Price to Earnings multiple (TTMPE) and check whether it is at a discount or a premium to the index. A significant mistake a lot of investors and fund managers make is to invest in high quality businesses at any price. The same increases the odds of a loss of capital or increases the holding period to recover capital. Retail investors often lack the patience to hold stocks for long and end up taking a capital hit. Best thumb rule for anyone is to not pay more than a TTM PE of 15x for B2B businesses and a TTM PE of 25x for a consumer facing business. The data below further backs this argument that in the short term (up to a 3 years of holding period), entry valuation is a significant determinant even amongst well managed companies. As the holding period increases to 5-10 years, entry valuation becomes less critical determinant to returns and capital protections.

To sum up, if we get the management and the business right, the odds of permanent loss of capital are less than 2%. Therefore, retail/SIP investors should focus on investing in clean managements running good quality businesses that are available at a reasonable price.    

Investor Memo - Aug 2022

Dear Investors, 

Hope you are doing well. Below is the chart depicting our fund returns viz index.

When to Exit? 

This month we wanted to discuss our framework on when to exit a stock. Many of you have discussed with us the timing of our exits when the markets have peaked in the background. 

We believe that exit is the most difficult skill a fund manager masters. Needless to say, we have got the same wrong too, at times. What makes things difficult is the emotional cost of staying invested in a stock. It has the ability to colour our decision making. 

We therefore write down our exit conditions when we get in any company or stock and always track the company against that exit condition. This three-point exit framework helps us stay unbiased/unemotional about our exits: 

Exit at any price if we discover any material and credible red flag on the corporate governance, capital misallocation of the promoters. 

If there is any change in assumption on the quality/governance of the promoter, it is best to exit the stock. We have often seen that rich valuations of a stock are supported by a belief in the managements’ ability and their fair treatment of minority shareholders. This trust is often built over years. We have seen time and again examples (Yes bank, DHFL, RBL, Manpasand, Capacite Infra) where a material red flag on corporate governance can significantly de-rate a stock by as much as 80-90%. It is therefore best to exit a stock when we discover any material and credible red flag. 

  1. Red flags around capital misallocation (eg: Exide, Kirloskar Oil, Bajaj Consumer) where a management enters not related businesses is often a sign of an incapable management. We believe that if a management has surplus cash (over and above what it needs to support its business growth) it should distribute the same back with shareholders in the form of dividend/buyback. We may sometimes go wrong in assessing a management’s ability to launch a new business successfully. We however believe that any new business typically takes >5 years to establish, a timeframe which is beyond our investment horizon. For that time, the new business is often a drag on the profitability of the existing business. 

  2. We do not like over-acquisitive management for the same reason as given above. It has been proven statistically and operationally that mergers/acquisitions are difficult to execute. Managements who are always acquiring are in a state of flux, which hurts a company’s profitability.  We recently exited NAZARA (a gaming company) for the same reason. Their acquisitions in not related categories is a way to buy topline. We also believe that it typically takes 4-5 years for any M&A to fructify in synergies, a period beyond our investment horizon.

  3. Lastly, a management's corporate governance track record once tainted, remains tainted, till there is a change of ownership.   

Any material deviation from the stated business/growth plan leads us to reassess the decision to stay invested or allocate more capital to the stock. 

We are usually patient in our approach to assess the execution capability of a management and prefer to have a point of view after 9-12 months of investment. This helps us segregate events that are in the control and that are out of control of a management.  We have often seen that markets are more focused on QoQ performance than the plan over 2-3 years. A management might miss its earnings estimate in a quarter due to events that are one time or not in the control of a management (war, supply shock, trade embargo, commodity price spiralling up). This creates a buying opportunity for us, rather than an exit opportunity. On the flip side, if we believe that an event can dent the earnings of a company for more than 12 months, we prefer to exit or trim our position in a phased manner and revisit the company after the 12 month period. 

Lastly, we invest at conservative trailing PE multiples and are not too greedy in deciding the exit multiple. 

While investing, we define a reasonable exit multiple (typically 70-80% percentile) and stick to the same in exit. For example: In our IT investments, we invested at a PE multiple of 8-12 x in Birlasoft and started exiting the stock at a PE multiple of 30-35x. In Mphasis, we started entering the stock at a PE multiple of 12-15x and exited the stock at a PE multiple of 35-40x. In TD power, we started entering at TTM PE of ~ 8x and have started exiting at a TTM PE of 25-30x. We believe that odds of things going wrong are higher at rich multiples and hence one should re-allocate that capital to ideas where odds of making a sustainable 20-25% IRR are higher.   

We would also like to share our recent coverage in Zee business titled: What are five key things to keep in mind for successful long-term investing - Analyst decodes

Thanks 

Prescient Capital

Investor Memo- July 2022

Dear Investor,

Hope you are doing well. Below is the chart comparing our returns to BSE 500:

Below is our review of the YTD Indian macros,their impact on equities and the way ahead.    

Macros for Indian business in YTDFY22 are a case of glass half full


The first half of 2022 has passed so it will be worthwhile to study performance of Indian equities, understand the key trends and develop an informed opinion of how the rest of the year may pan out for equities. It will be an understatement to say that it has been a difficult and volatile phase for Indian equities since the start of 2022. The large cap benchmark BSE Sensex has corrected by ~8% in YTD2022 while BSE Midcap and BSE Smallcap indices have corrected by 10.3% and 14% respectively. The drawdown is even higher when considered from the all-time highs achieved by Indian equities during Q3FY21. In our view, the correction has been mainly driven by global macroeconomic factors like: 


  • Decadal high inflation in commodity and energy prices mainly due to global supply chain issues; key ones being ongoing Russia-Ukraine war and lockdowns in China till recently due to its stringent zero covid tolerance policy.

  • Heating up of the US economy due to liberal fiscal and monetary policies as well as inflation is driving the US Fed to hike rates. There is a fear that the Fed will have to hike rates sharply inducing a recession in the US in 2023. 

  • High inflation forcing all central banks including India to hike rates resulting in subdued consumer spending and ensuing fall in global GDP leading to fears of stagflation globally.


While global macros have turned negative since start of 2022, India has witnessed several positive macro factors in last 1 year:


  • Indian corporate profits are at multi year high while corporate leverage is at a decadal low. Cumulative profits of top 500 market cap companies as a % of GDP hit a 11-year high of 4.3 per cent in FY22. As per India’s leading credit rating agency CRISIL, the number of credit rating upgrades to downgrades reached a decadal high in FY22.

  • Indian banking sector NPAs have fallen significantly from their peak in FY18 and will reach decadal lows by FY24. Indian credit growth is witnessing a revival after subdued growth for the past several years.

  • In FY22, India achieved the highest ever merchandise exports of US$ 418Bn, a 43% increase from FY21 and a 33% increase from FY20 (pre-covid year). What is even more positive is that there has been a significant improvement in exports mix towards more value added products. Share of conventional goods like gems/jewellery has reduced from 16% in FY17 to 9% in FY22 while share of engineering goods, which has become India’s top exported product, increased from a meagre 5% in FY17 to 27% in FY22.

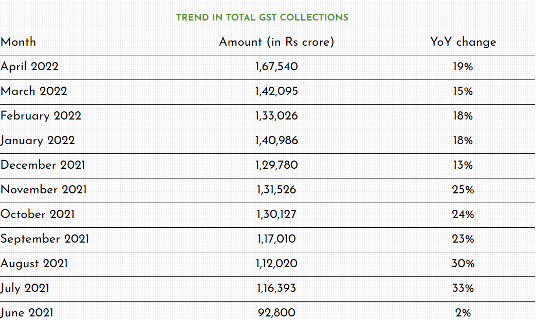
  • Monthly GST collection hit an all-time high in April 2022 and has remained above the key level of 1 lakh Cr / month since July 2021. A portion of this growth is due to stricter tax compliance and stronger anti-evasion measures but this is also being driven by strong economic revival.

  • After a decade-long slump, there are early signs of revival in urban real estate demand. Housing prices as well as sales have seen good growth in most of the key Indian real estate markets.  


Negatives seem almost priced in; incremental positives can drive a strong rebound


Equities globally have seen significant correction to the tune of 15-20% or more in the last 6 months with several markets entering into a bear phase. Indian markets have also witnessed similar levels of correction due to fear of global macros worsening and relentless selling by FIIs while we believe most of the Indian macro positives have been overlooked. There is no doubt that high inflation and consequent rate hikes pose risk to Indian economic revival while global slowdown will definitely have an impact on Indian exports. Moreover, rise in crude prices is already leading to higher trade deficit and further price rise can worsen the situation. 


However, we feel that significant correction in Indian equities since the start of 2022 has factored in most of these apparent negative macros. Any incremental positive indicators on inflation can lead to strong rebound in the markets towards the end of 2022. There are already signs of inflation peaking with prices of agri commodities and metals cooling off substantially from their highs in the last month. This resulted in significant outperformance of auto stocks as the auto sector is a large consumer of commodities. Nifty Auto has gained 6.4% in the last 1 month compared to just a 0.12% rise in Nifty 50. Crude, natural gas and energy prices have not shown any meaningful signs of correction so far but our sense is that inflation may top out in the next 2-3 months. If that happens, then there can be a meaningful rebound in Indian equities post that especially if Indian corporate earnings growth remains strong.


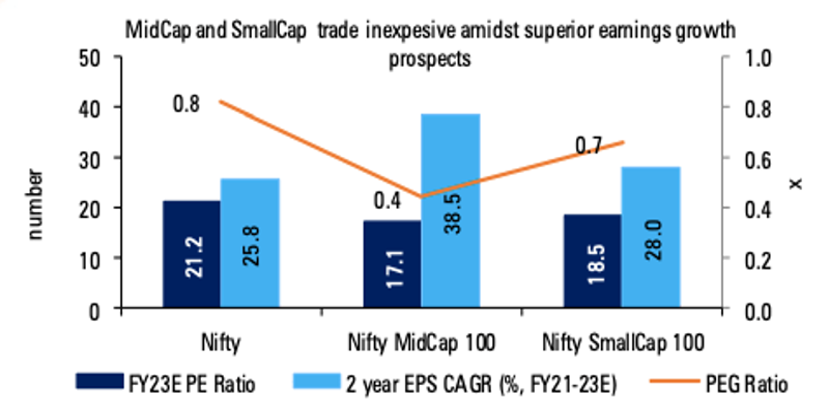
Moreover, valuations have become quite attractive after the 15-30% correction in several high quality businesses from their peaks in the last 6 months. Historically, Indian equities have delivered healthy returns over 3-5 year period following a correction of 15-20% over a 6 months period so there is no reason to believe this time will be different. This correction has brought about a sanity in valuations and taken out the froth from the market that was evident in the unjustifiably high valuations of IPOs, especially of new age cash burning tech businesses, and of certain fad sectors last year. In the last 6 months, this correction has brought back a focus on business fundamentals like cash flow generation, pricing power and sound capital allocation. Despite the substantial overall correction, there have been several strong businesses from sectors like capital goods & engineering, auto, agrochemicals, etc, which were neglected by investors over the last few years, that have delivered exceptional returns in the last 1 year. We believe it is time to invest in quality businesses that are available at attractive valuations to generate healthy returns over the next 3-5 years.

Time to be stock specific


Post this correction, valuations are attractive but it is essential to do proper research to invest in quality businesses with strong growth prospects. We believe that certain sectors will outperform in the next few years and it is important to invest in quality names from these sectors. The first sector that looks quite attractive is capital goods and engineering. After almost a decade, there are early signs of capex revival in India as capex heavy sectors like metals, cement, power, etc have plans of significant capacity addition over next few years. In the overall engineering space, there are segments in which unorganized players as well as weak players with poor financial practices have been weeded out during the prolonged downturn of the last decade. As a result, there are several niche market leaders that have gained significant market share and are poised to benefit in a big way from revival in the Indian capex cycle. Moreover, some of these leaders have significantly increased their exports business because the downturn in the domestic market forced their quality management to increase their international business by spending considerable money and effort on R&D, market development and relationship building with international clients. We believe it is a great opportunity to invest in such niche segment leaders in the engineering & capital goods space that have been able to diversify into international markets as well.


The second sector we are quite bullish about is auto ancillaries. The Indian auto sector has been through a very challenging phase over FY19-22 because of multiple issues like multiple Covid lockdowns, semiconductor shortages impacting production, weak demand due to significant increase in vehicle prices due to regulatory changes, etc. The result is that India auto sales in FY22 is either at the same or lower level than FY17 sales. However, factors like cyclical revival in the economy (especially positive for commercial vehicles), significant improvement in semiconductor supply, preference for personal mobility, etc are expected to lead to a meaningful revival in sales of cars and commercial vehicles over the next few years. Even though auto OEM valuations are not that attractive, several quality auto component manufacturers are available at cheap valuations. What is also interesting is that quite a few ancillaries have also been able to meaningfully increase their exports and are suppliers to several global OEMs just like select engineering players. Moreover, several ancillaries were early in identifying opportunities presented by the transition to EVs and in developing solutions for EVs. It is difficult to place a bet on which OEM will make the most successful transition to EV. However, there are several ancillaries that are vendors of EV specific solutions like suspension components, bearings, LED automotive lights, etc to several EV OEMs not just in India but globally. Such players might have several competitors in the ICE space but in the EV space they are the sole supplier of their respective components to EV OEMs. Select auto ancillaries that have been able to meaningfully increase exports over last 2-3 years or are ahead of their competitors in developing solutions for the EV space will be able to grow faster than the Indian auto sector, which anyway is poised for strong growth. We believe now is a good time to invest in such auto ancillaries when valuations are attractive.


Lastly, we are quite bullish about the agrochemical space because prices of agri commodities remain quite healthy even after the recent correction. India has witnessed a normal monsoon for the last 3-4 years and this year is also expected to receive a normal monsoon. Farm economics are quite healthy globally so agrochemical demand is expected to be strong. We are especially bullish about agrochemical exporters as international markets are less price sensitive making it relatively easier to take price hikes in these markets. Since prices of several intermediates mainly imported from China have significantly increased since last year due to lockdowns and other supply chain challenges, export focused agrochemical players have been able to better protect their profitability compared to domestic focused ones as the Indian market is more price sensitive making it difficult to pass on input cost inflation. FY22 was a strong year for export focused agrochemical players and we expect the demand prospects to remain buoyant this year. 


In summary, we believe this correction has presented an opportunity for long term investors to invest in quality business at very reasonable valuation. It is impossible to predict a market bottom but we believe investors should start investing gradually to take advantage of the current drawdown as healthy returns are only generated by initiating investments in a bear market.


Prescient Capital

https://www.prescientcap.com


Investor Memo May 2022

Dear Investor,

Below is a chart depicting our returns viz BSE 500:

In this monthly update we plan to highlight the performance of our portfolio companies in FY 22. Key observations are:


  • Our portfolio companies demonstrated a median YOY sales and earnings growth of 23% and 15% respectively. The earnings growth was lower than the sales growth due to the impact of rise in raw material prices when compared to the last year.  

  • Despite lockdowns our portfolio companies have grown at a 3-year sales (FY 22/FY 19) and earnings CAGR of 13% and 23% respectively.

  • Our portfolio companies have used this period to become more capital efficient. Their median ROE for FY 22 (18.5%) was higher than their 3-year average ROE of 17.4%.

  • The cash flow from ops (ex-Banking companies), has dipped YOY, due to the high raw material prices. Companies have stocked extra inventory and/or have paid higher advances to their vendors to secure supply. Our portfolio companies are still able to convert ~ 80% of their PAT into Cash flows. This ratio was >1x for the previous years. 

  • There is negligible leverage on the books of our portfolio companies. Their median Debt to Equity ratio is 0.1x.

  • We continue to stay bullish on our portfolio companies and plan to deploy your capital at a steady pace.  

  • The median PE multiple of our portfolio companies is 19.5 viz PE multiple of 23x for the BSE 500 index. Refer below.

  • Our portfolio has seen a drawdown of 10-15% (across portfolios) compared to a drawdown of 14-15% for the BSE Midcap and BSE Small cap index. The drawdown for the BSE SENSEX has been ~ 10% during this period. Considering we run a much more concentrated portfolio, we believe the that the strong results of our portfolio companies give us a good footing in these volatile times.  

  • The below scatter plot depicts, our portfolio’s PE multiple to its YOY earnings growth. As discussed in our earlier communications as well, we try to enter a company at lower than a PE of 20x (non-FMCG) and 30x for FMCG (consumer facing) companies. This gives us enough headroom for multiple expansion when a company demonstrates better than expected results.  We are also in the process of exiting companies where the risk/reward between growth and valuation is not in our favor (eg: NAZARA Games exited from the portfolio).

Investment Thesis of Mrs. Bector Foods.

Lastly, we presented one of our portfolio companies (Mrs. Bector Foods) at an Investor forum.  Below is the link to our thesis.

Link: https://www.youtube.com/watch?v=_SrNsU8SbTQ

Thanks

Prescient Capital

Investor Memo April 2022

Dear Investor,

The last quarter has been a difficult phase for equities, which is also reflected in the drawdown in our portfolio. We believe the market will continue to see a time and probably some price correction in the next 2 quarters. However, we continue to remain optimistic that we are at the start of an earnings cycle that will drive reasonable stock returns over the next 3-5 years. We think any volatility in markets near term will provide us a great opportunity to buy stocks at attractive valuations. In this month’s update, we look at both the negative factors impacting near time performance as well as some of the positives that keep our optimism regarding long term performance of Indian equities intact.

First, we discuss the negative factors:

Impact of US Fed rate hikes

We think in the near term, Fed raising rates remains a significant risk for markets. A normalization of the Fed policy is inevitable and partly priced into markets. However, the medium term impact of a Fed rate hike is dependent on other factors, the key one being India’s GDP growth as well as growth in Indian corporate profits. During 2004-06, Fed hiked rates 17 times by 25 bps each. During the same period, Nifty went up 99.1% though the Dow Jones went up only 7.2%. This is because India witnessed strong GDP as well as corporate earnings growth. During the 2015 cycle, which was more sober, Fed hiked rates by 2.25%. Markets went up during this period too with Nifty rising 40.1% and Dow Jones rising 31.4%. However, in both these cycles, the markets corrected initially in the first few months. So, a Fed rate hike independently is not a clear indicator of market correction in the medium to long term.

Impact of Russia-Ukraine war

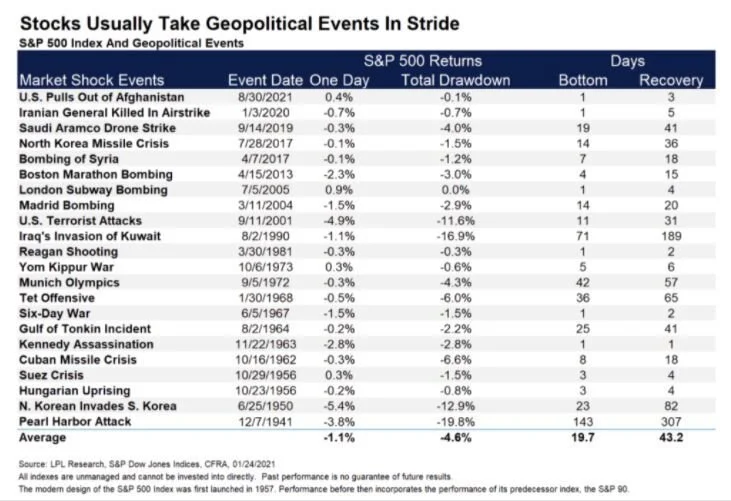
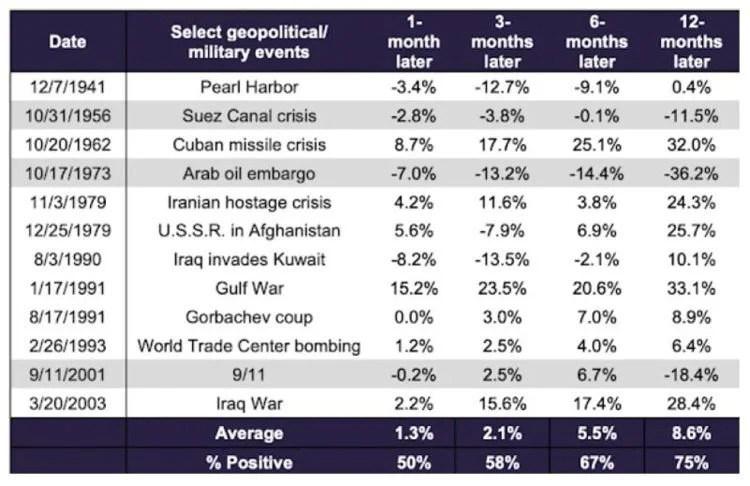
We have discussed the impact of this war in a previous update and continue to believe that military conflicts do not adversely impact returns beyond a year based on historical evidence. We cannot add any new insights to multiple geopolitical perspectives that already exist on this subject but agree that the conflict is reinforcing the inflation fears with commodity prices spiking due to sanctions on Russia. We believe inflation was a concern even before this war started and currently also there are equally impactful factors like the Covid lockdowns in China resulting in a spike in inflation. 

Impact of Inflation

We consider inflation to be the biggest risk to equity returns in the near term. Other factors like Fed rate hike, reduction in Fed balance sheet, fear of recession in US and slower growth in India, etc are consequences or responses to rising inflation. Inflation in the USA currently at 8.5% is at its highest since 1982. The Fed rate at that time hit a high of more than 10% compared to the 0.25-0.50% currently. Hence, even with a slightly lower inflation, we may continue to see multiple Fed rate increases though possibly at a slower pace. Inflation will impact profitability of Indian businesses, including our investments, in the current quarter (Q4FY22) as well as next one (Q1FY23). Companies including ones in our portfolio have been taking price hikes, though with a lag, to pass on the input and energy inflation depending on their purchasing power. However, we acknowledge that inflation will remain a challenge over next few quarters and will hopefully ease off during the later part of FY23 when Covid situation improves in China and with a possible resolution to supply side bottlenecks in energy. As discussed with some of you in recent interactions, we are cautious about impact of inflation on our portfolio positions and monitoring 2 key factors to better handle impact of inflation on portfolio performance: 

  • Firstly, we are tracking sectors/companies that can take price hikes (IT services, pharma, consumer) to pass on input inflation without adversely impacting demand or maybe are even benefiting from inflation (agrochemicals). We have decent allocation in each and will even increase allocation if our expectations are met or exceeded in the current quarter (Q4FY22) performance.

  • Secondly, we are tracking sectors/companies that are not directly impacted by commodity and energy inflation but will witness revival as Covid related concerns subside (mainly BFSI).

We do have decent exposure to sectors like auto ancillaries, consumer and cement that are getting and will be impacted by rising inflation. In case of auto ancillaries, though the inflation will impact profitability over a few quarters, we believe there should be a strong cyclical revival in demand as auto sales have plummeted to decadal lows in the past few years. Also, all our investments in auto ancillaries are bottoms up stories that benefit from increase in LED auto lighting penetration in EVs, tightening emission norms, increased outsourcing to Indian forging players and NPD for EVs and hybrids. We believe that these company specific tailwinds will help these portfolio companies meaningfully outperform the Indian auto industry over 3 years+ horizon. 

Similarly, all our investments in consumer space are bottoms up stories that benefit from the growth in demand for housing/building materials increased penetration of organized players in packaged food, and segmentation of demand in wellness products. Though demand may be impacted in the consumer space due to multiple price hikes taken by companies, we believe our portfolio of consumer companies will deliver higher than industry growth as they have used this time to expand from a regional player to a national player. 

Cement is one industry where we are cautious because it is mostly severely impacted by energy inflation (fuel & power and freight costs is roughly 40-45% of revenue). Our thesis of investing in cement is based on strong demand revival in residential real estate after a decade-long slump and high infra spending by govt. Also, we were enthused by the continued pricing power demonstrated by the industry, driven by significant consolidation, during the last 2-2.5 years. However, the recent hikes in price of crude (> 100$), coal (increase of 100%+ yoy as well as shortage situation), etc have made it impossible for the sector to take price hikes to pass on input inflation. So, the earnings will be impacted over next few quarters, but we believe the sharp correction in cement stocks have more than factored in these factors. We continue to remain optimistic about the medium to long term performance of the Indian cement sector because strong demand drivers remain intact and expect the industry to further consolidate. Overall, we will monitor the inflation situation and will rejig the portfolio based on the above-mentioned performance indicators.

We feel that negative macro factors have been widely covered in recent times. However, there are India specific positive macro factors that we highlight below. At some level, long term equity investing needs us to be optimistic about medium to long term prospects and the below indicators offer hope in these difficult times.

Banking System NPAs bottoming out

Revival in the credit cycle is crucial to sustaining strong economic growth. During the last decade, credit growth was hampered by the ballooning bad debt of Indian lenders. However, the sector has cleaned up bad debts in the last 3-4 years and NPAs are set to bottom out to a decadal low by FY24 as highlighted in a research report by brokerage Motilal Oswal (MOSL). This should support a strong revival in credit growth and help support India’s growth over next few years.

Revival in corporate earnings and CAPEX cycle

Earnings growth was 32% yoy in the Dec 2021 quarter (Q3FY22) for the broader Indian market. Due to the impact of COVID in Dec 2020, it makes more sense to compare Dec 2021 quarter earnings and Dec 2019 quarter earnings. Growth in earnings in this period for the broader market was 120%. Even after excluding financials, the earnings growth for the broader market was 79%. Earnings for mid-caps grew faster than large-caps and small-caps earnings grew fastest. The strong earnings growth is of course also helped in manifold jump in earnings of commodity companies like refiners, petrochemical manufacturers, metals, mining, paper, cotton yarn makers, etc. That might be a cyclical factor, but it does help other sectors like capital goods, engineering, construction, etc immensely as these commodity companies are the largest capex spenders in the economy. After almost a decade, these sectors have the healthiest balance sheet and near full utilization levels and have thus announced huge capex plans over the next few years. This article highlights the same  - 

https://www.moneycontrol.com/news/business/economy/fresh-capex-announcements-by-private-manufacturers-up-210-in-fy22-says-goldman-8418841.html

Though, we don’t invest in commodities (except cement), this capex drive will help sectors of our interest like capital goods, engineering, building materials, etc.

GST collections have been rising m-o-m again indicating good health of Indian corporates

Monthly GST collection hit an all time high in April 2022 and have remained above the key level of 1 lakh Cr / month since July 2021. Q1FY22 (mainly May and June 2021) were impacted by the second wave of Covid but since then GST collections have been higher on a yoy basis every month. A portion of this growth is due to stricter tax compliance and stronger anti-evasion measures but that does not explain the entire increase. Strong economic revival has also resulted in this growth in GST collections. Not only GST, overall tax revenues for Indian govt. have increased sharply in FY22 beating the govt.’s own estimates repeatedly -

https://www.hindustantimes.com/india-news/govts-tax-revenue-in-fy22-jumps-34-at-rs-27-lakh-cr-crossing-target-by-rs-5-lakh-cr-101649968830708.html.

This is a big positive as it helps govt.’s ability to spend on infra as well as several PLI (Production linked incentives) schemes it has announced for multiple sectors.

Revival in residential real estate

After a decade long slump, there are early signs of revival in urban real estate demand helped by decadal low home loan rates, need for larger houses due to trend of wfh (work from home) and reduction in supply demand mismatch – 

https://www.theweek.in/news/biz-tech/2022/01/03/housing-launches-up-85-as-realty-revival-continues.html

https://economictimes.indiatimes.com/industry/services/property-/-cstruction/positive-outlook-for-indias-real-estate-sector-as-healthy-demand-expected-2022-outlook-report/articleshow/88186247.cms?from=mdr

Real estate is a key sector of the economy as construction is one of the biggest employers and it is also a big demand driver for building materials and other ancillary sectors. Also, when real estate does well, it has a big wealth effect and improves overall consumer sentiment. If the real estate revival sustains, it will be a big positive for Indian economic revival.

To summarise, we are cautious about the near term (next 6-9 months) performance of Indian equities and believe this will be a volatile phase with limited upside, if any, but we continue to remain positive about the long-term prospects. Unprecedented inflation is a key risk challenging corporate profitability so we will keep monitoring its impact on our portfolio positions and rejig the portfolio accordingly. 

Prescient Capital


Investor Memo-March 2022

Dear Investors, 

Hope you are doing well. Below is the chart depicting our portfolio returns to date viz BSE 500 index.  

In this memo, we wanted to highlight three points: 


  1. The Russian/Ukraine war has been a no event for financial markets

  2. The lockdowns in China is likely impact global supply chains for another 12 months

  3. The impending food inflation can impact demand in India

SUMMARY: We maintain that this is a good time to invest. We are investing incrementally in Pharma, IT, Consumer, BFSI and Manufacturing.    

Markets back to where they were pre the Russia-Ukraine conflict

We begin with the discussion from where we left in our last memo where we highlighted that statistically speaking markets tend to overreact to geo-political conflicts in the short term and recover well in the medium termThe same has played out. The MSCI all country world index is now trading higher than the value when NATO first raised the alarm bell for an attack. Thanks to this panic selling, fund managers having a long term investment outlook had a good buying window. Refer below: 

Similar trend has been seen in the BSE 500 index which is up by ~ 9% from its lows in the last 3 months. During the same period, the divergence in the returns of sectors that have been adversely impacted by energy/oil (Cement, chemicals, manufacturing) and sectors that are not (Energy, Mining, Metal, O&G) has been significant. Refer to the chart below. 

While we would love to find investable (>15% ROCE) businesses in these sectors, the cyclicality in price and inability of the managements by-and-large to control their P&L, makes us cautious. As a result, you would see our portfolio performance lag energy/commodity indices in the short term. 

Our investing framework is most suited to finding sectors/companies that have a strong MOAT, have underperformed in the past due to non structural reasons, and have a good growth outlook which is not baked in the current valuations. As displayed in the 1 to 5 year data above, we find the risk reward between growth and valuation right in the following sectors: 

  1. Auto/auto-anc (~ 20% of portfolio): Growth driven by strong exports and EV tailwinds. Valuations still in mid- teens.

  2. Pharma/Agrichem (~25-30% of portfolio): Domestic branded pharma growing at steady pace. Spl chemicals exports continue to expand.

  3. BFSI (10-12% of portfolio): Credit growth improving MoM, valuation at bottom 10-30% percentile.

  4. Consumer and Consumer tech (~20% of portfolio): Able to pass on RM price rises. Demand remains robust so far.

  5. IT/ITES (~ 15% of portfolio): Selectively investing in names where valuation is at par with growth. 

The lockdown in China and its likely impact on global supply chains

The recent stringent lockdowns in China have been in response to a sub variant of Omicron. The same has affected ~ 50-60 mn people in 5-7 major cities in China. The same has disrupted functioning of ports, mfg plants, mines and the like. Honk-Kong and Korea are already reeling under their worst COVID-19 spread. The situation could become worse for the next 3-6 months and can not only further hamper supply chains but could also lead to a rise in COVID infections in India. We have typically seen a 3-6 months lag between caseload rise in China and India. We are therefore carefully evaluating our portfolio for any future disruptions in topline and margins.          

The impending food inflation and its impact

The Reserve bank has been so far maintaining its low interest rates/pro-growth stance largely due to range bound numbers of inflation. Refer below. 

We however believe that the food inflation would rise significantly in the near term. The urban demand environment for consumer goods has been buoyant so far. We believe that future pressure in prices of wheat, oil and packaged goods can dampen demand for the near term. Our future portfolio additions in consumer goods will be determined by QoQ performance on earnings.     

Please feel free to write to us. 

Prescient Capital

Contact us: https://www.prescientcap.com/contactform

Great time to invest follow on capital-Prescient Capital

Dear Investors, 

You are well aware that there has been a sharp and quick global correction in equities since the start of Feb 2022 due to the fear of the impact of the Russia-Ukraine war (charts below) on the global economy. This is very similar to the quick and sharp correction that had happened in March 2020 due to fear of unknown impact of Covid-19 on the global economy. Our portfolios have fallen in line with the correction in benchmark indices and we understand that such a sharp drawdown would be a cause of concern to you. 

We write this interim memo to highlight the need for a capital call. We believe that this is one of the best times to deploy more capital in equities in general and with us in particular. We make the argument basis the following points: 

  • Our portfolio’s performance in Q3 remains strong and has no correlation with geo-political conflicts or with US interest rate/US inflation. Our portfolio companies have grown at a YOY sales CAGR of 12%. The earnings growth has been a mixed bag due to cost/wage pressures or fixed marketing/sales burn to support next year's high growth. We remain confident about the earnings performance of the outliers in the portfolio and see them reasonably valued (at a PE to growth ratio of less than one) post this correction. In fact a lion share of our portfolio companies have low correlation with Oil & Gas. Our investments in BFSI, IT, Consumer and Capital Goods have a low correlation with Oil & Gas price. We have been buying these companies off late and would want to allocate more capital behind these names. 

  • The BSE SENSEX has corrected to a PE of ~23x (was around 19x during the Mar 2020 lows) and is fairly valued. On the contrary, we have seen the best growth in the corporate earnings since the last 20 years. Refer charts below. We have covered the same in our Jan 2022 memo (Refer Jan Memo).

  • We are not experts in geopolitical conflicts. We however can draw some inferences from the correlation of markets to war. The charts below clearly highlight that markets tend to overreact to geo-political conflicts in the short term and recover well in the medium term. Infact, we believe that the only variable that matters in the end is how strong is the earnings growth.

  • We feel that the Ukraine war is a much less significant event than Covid-19 that had several social and business impacts like global supply chain disruption, reimagining of workspace, labor migration and great resignation, huge loss of lives, etc. Despite all these pandemic challenges, Indian businesses have fared very well and in fact are in the best of their health in a decade in terms of prospects of exports, leverage on their balance sheet, fiscal support from govt., early signs of capex revival in economy, etc. The main impact of the Ukraine war can be in terms of further inflation in energy prices. However, we believe the current govt. has done a commendable job in maintaining fiscal prudence and should be able to handle the situation relatively well. More importantly, Indian companies have been tackling rising inflation for a few quarters now and we believe fundamentally good businesses will be able to take steps like price hikes, cost control, etc to better handle rising costs. 

  • Just like during COVID-19 pandemic, some sectors and businesses were able to handle the situation well and emerge stronger, this time too different sectors and businesses will be able to better handle the crisis. Hopefully, as your fund manager, we will be able to identify those sectors and businesses that will do well and increase allocation to them. 

  • Lastly, we are not an expert at timing the market however we could see more market correction from hereon. Our plan is to deploy capital judiciously on days of correction and ride out this period.  However, if one is invested in quality and durable businesses that can deliver healthy earnings growth over the medium to long term (horizon of at least 2-3 years), then the risk of poor returns or permanent loss of capital is very low or non-existent. Many of our clients run or are in leadership roles in businesses and an important point to ponder is whether they believe their businesses have been impacted deeply by the Russia Ukraine war. It’s just that the price of listed businesses are determined by market sentiments every day that investors feel that their value is so volatile.


We believe that disproportionate returns are made by investing during times of macro-economic pessimism. We believe that we are in the middle of such a period. 

Please reach out to us for a detailed/informal discussion. Happy to share our views. 

Prescient Capital


Investor Memo Jan 2022

Dear Investor, 

Hope you and your loved ones are doing well and are safe from the third wave of the COVID pandemic. Below is a chart depicting the fund performance viz BSE 500 TRI index. 

In this memo we will discuss the following:  

  • How the global interest rates and the policy rates in India can affect the capital markets. 

  • Our portfolio’s PE, PEG ratio and the commentary around it. 

  • Why it is a good time to top-up your investments

Section 1: Macros

A lot of you would have read the recent commentary by US Fed Chief Mr. Jerome Powell on the possibility of a rate hike and a reduction in USD liquidity. The same had sent the global markets (Including India) in a nosedive during the last month. While we agree markets are in the rich/expensive multiples territory, we wanted to put some historical perspective to the same. The below chart highlights performance of the US markets and the Indian markets during the last few interest rate cycles. 

US market returns during different policy rate cycles:

Indian market returns during different repo rate cycles:

What we can infer from the above data is as follows: 

  • The data indicates that there is no stark difference between returns during the rate hike and rate drop cycles. For India the difference is even more marginal.

  • Interest rates affect the markets in different ways and the most important of those is triggered by inflation. High inflation for the medium to longer term can suppress demand. In the last 4-5 years, India has seen one of the lowest consumer price inflation when compared to the last decade. As we speak, CPI is rising and may influence policy rates in the near term. Refer CPI chart below:

  • Inflation also triggers higher lending rates. It has been seen that banks/NBFCs margins expand during a rising rate cycle, which in turn boost their earnings and markets (BFSI is ~ 36% of index). The fallout though is that the CAPEX cycle weakens and can affect the longer-term growth of the Manufacturing/infrastructure sector; something that countries such as India (which have seen a lost decade of CAPEX) cannot afford. We have already seen a big push by GOI on infra/manufacturing and PLI during this budget. Refer to the chart below on Gross Fixed Capital Formation (GFCF) of India which is barely back to pre-covid levels.

  • We believe that the more dominant driver of returns in the market is the growth in corporate earnings. Markets have come under pressure when growth of corporate earnings do not keep pace with the underlying multiples. 

  • The data below corroborates what we have been discussing in the past memos (Refer November and December 2021 memos here) that growth in corporate earnings are in their best cycle in the last 20 years. The charts below highlight that we are in a cycle similar to the 2003-07 cycle. 

Section 2: Portfolio Review

Bottoms up investors like us see the economy from the eyes of the companies we invest in. We find hard working and ethical entrepreneurs that are growing their businesses at >15% CAGR and are available at reasonable valuations. Sometimes the reward of the same is back ended and the journey in between is full of doubts, but time has taught us that real returns are made by investing when a company’s earnings are breaking out, and valuations are cheap. We stick with those companies even at the cost of returns in the 3-9 months but believe that mean reversion would happen. We sell these companies when the business fundamentally changes or the incremental PE to Growth ratio (PEG) is not in our favor. We would like to highlight the same through some of the examples in our portfolio: 

* Returns calculated by taking the price of first entry and first exit. Yellow: Exit, Green: Current

Key points to make are:

  • Our winners have been companies that are run by great founders and were at the cusp of their high growth when we invested. The markets however didn’t price in this growth or was looking elsewhere. This fundamentally created a gap between their reasonable valuation and future growth. Such companies barely move for a while. The wait can extend from 3 to 24 months. 

  • The process however is to have a sharp focus on sustainable growth in earnings and to have some patience. 

  • As you would see some of these companies still have a Price Earning to Growth multiple of less than 1. This implies that their growth/growth potential is still not factored in their valuation. We continue to build our position in such companies. 

  • You would also see we have exited a few companies where the Price Earning to Growth multiple is far greater than 1, implying that the valuation bakes in too much growth which is not coming. We would rather sit out and wait for a correction that hope growth catches up with valuation. 

We are still comfortable with our Portfolio’s PE multiple and continue to find opportunities in BFSI, auto ancillaries, IT/ITES and consumer. Refer chart below:

Median PE multiple

Section 3: Time to top up your investments

Based on both our bottoms up and top-down discussed above, we can safely say that this is a good time to top up your investments. The recent and near-term correction in the US/Global markets has nothing to do with the intrinsic growth of Indian companies in general and our portfolio companies in particular. It has made investing in companies we like more compelling. Our portfolio companies are growing well and are available at reasonable valuations. We would want to deploy more capital at this stage and enhance your portfolio returns.  

Please feel free to reach out to us if you have any queries / concerns.

Regards

Prescient Capital

Contact us: https://www.prescientcap.com/contactform

Investor Memo Dec 2021

Dear Investor, 

Wish you and your family a very happy, healthy and prosperous 2022. 

Below is a chart depicting our portfolio returns viz BSE 500 TRI index. 

As 2021 ended, we are sharing some interesting insights and data from 2021:

  • Indian equities as represented by benchmark index Nifty 50 have delivered an annual positive return in 20 out of the last 28 years (71% probability of positive return in a year). So, the odds of positive returns are quite healthy entering any given year. On the other hand, the longest streak of positive return years is 6. So for 2022 to be a positive return year, it will have to break a historical record as last 6 years have already delivered continuous positive returns. It is up to you as an optimist or pessimist on how you believe 2022 will pan out for Indian equities.

  • The last 2 years have taught us that equity markets are completely unpredictable and no one can predict the short to medium trend of equities. No one predicted the sharp fall witnessed in March 2020 as well as no one foretold the subsequent rally in equities from April 2020 to Sep 2021. Below is a table of quotes form some of the greatest investors and economists (some of them Noble laureates) predicting a severe bear market in March 2020 and the market humbled them all.

We believe and have seen firsthand in our investing journey that the only prediction that has always worked is “ Time is the friend of the wonderful company, enemy of the mediocre” by Warren Buffet. Long term investing in high quality businesses has always delivered healthy returns irrespective of market cycles.

  • The general perception is that the markets are overvalued post the rally since March 2020 but that is incorrect. NIFTY 50 index (a market benchmark) was trading at P/E of 24.11 on 31st Dec 2021. This is very close to the last 10 year median P/E multiple of NIFTY 50 that is 23.34 as can be seen from the chart below:

Actually the rally in 2021 was driven by strong earnings growth and P/E of NIFTY 50 compressed from 38.55 on 1st Jan 2021 to 24.11 on 31st Dec 2021. This is despite the 24% rally in NIFTY 50 because the earnings growth was much higher. We believe earnings of listed Indian businesses will continue to be strong in 2022 and will drive market returns. The table below shows the strong expected earnings growth for FY23:

  • Another common misconception is that smallcap and midcap companies are in a bubble zone as they have rallied more than large cap companies. While it is true that small and mid cap companies have delivered higher returns than large cap companies, it has to be seen in the context of the fact that they have also delivered higher earnings growth and are expected to continue that trend. The chart below compares the 2 year forward (FY23) P/E with expected earnings growth (Bloomberg consensus) of small (represented by NIFTY Smallcap 100), mid (NIFTY Midcap 100) and large cap (NIFTY 50) companies. As can be seen, small and mid cap companies are not trading at higher valuations compared to large caps once the strong earnings growth is factored in.

  • The rally in Indian equities in 2021 was quite broad with all sectoral indices ending in green as can be seen from table below. However, there was a rotation in sector leadership in terms of returns delivered from 2020 to 2021. Pharma which was the top performing sector in 2020 was the second worst performing sector in 2021. The top 3 performers of 2021 were metals, IT and real estate but metals and real estate had delivered meagre returns in 2020.

IT services continued its dream run delivering 50%+ return for the 2nd consecutive year. This performance is mirrored in the boom that technology is currently witnessing – tech adoption has become a top priority for every industry not only for productivity improvement but basic business continuity since start of Covid-19 pandemic, adoption of digital sales and marketing channels has become a do or die for businesses, talent crunch is severely acute in technology resulting in best ever compensations and high attrition, etc. The rally in commodities and metals in 2021 is being driven by supply chain disruptions due to the pandemic and is resulting in high inflation. Sectors like auto, financial services and FMCG have been underperforming for the last 2 years since the pandemic began. While we believe that the underperformance in FMCG is justified given the very high valuations consumer companies were trading at, auto and financials should perform strongly going ahead. Some of our investing decisions related to this data are:

  • We believe IT services is in a structural bull run for the next 2-3 years due to the strong demand for digital adoption. We have a healthy allocation to IT services with 2 positions – eClerx and R Systems. Ideally we would have had an even higher allocation to ITS but valuations for most listed IT companies have run up significantly and we are only comfortable with the valuation of these 2 names.

  • Earnings growth prospects are not as strong or broad based for the pharma sector as for ITS. There are 2 challenges for the Indian pharma sector: One is on the supply side due to its heavy reliance on China for key starting materials and intermediates. The other is the intense competition in generic drug markets especially the US, which is the largest export market for Indian pharma. It is very difficult to make a call on how long it will take to resolve or to even understand the nature of the supply side challenges in China. Similarly, it is very difficult to understand the competitive landscape in the US generics market as well as the regulatory challenges posed by heavy scrutiny by US drug regulator US FDA. So, we have decided to stay away from pharma companies that have a heavy reliance on China inputs and also those that have a very large contribution of business from generics. We continue to be quite bullish about the prospects of companies that derive majority of revenues from Indian branded drugs business because these have the pricing power to pass on input cost inflation and maintain margins as well as are witnessing strong growth in Indian drug demand. So we remain invested in India branded pharma focused companies like Ajanta Pharma, JB Chemicals & Pharma, Alkem, etc. We are also excited about pharma businesses that are very R&D driven and focused on niche and very high value drugs like Natco.

  • Auto sector has been impacted by multiple factors that are not at all related to demand like multiple lockdowns that impacted auto retailing over the last 2 years, acute supply side shortages in semiconductor chips that has crippled global auto production, etc. In fact, there is a significant pent up demand and order backlog for cars in India as well as globally but OEMs are unable to manufacture to meet that due to the ongoing chip shortage. It is difficult to predict when the global auto chip shortage issue will be resolved but we are still excited about auto components manufacturers that have large export contribution in revenues (like GNA Axles, NRB Bearings) and / or are focusing on developing products for EVs (like FIEM, NRB). We believe globally competitive auto component manufacturers that are focusing on exports as well as tapping the EV opportunity can deliver much higher than industry earnings growth.

  • Lenders (banks, NBFCs, HFCs, MFIs, etc) have been the biggest laggards in the last 2 years due to valid concerns on impact of the Covid-19 pandemic on asset quality as well as on loan growth. However, we believe that certain pockets like housing finance and retail focused banks will do well due to the strong revival in real estate demand (helping HFCs) and strong retail liability franchise (helping retail focused banks). So, we are quite bullish about the prospect of our investment in IDFC First bank and Can Fin Homes.

Overall, we believe that 2022 will not deliver the very high returns that the last 2 year delivered simply because starting valuations are not that attractive as 2 years back. So, investors need to temper their expectations from 2022 but we do believe that earnings growth will be strong in certain pockets of the economy. 2022 will definitely not witness a broad based rally in Indian equities like last year but with proper stock selection, we believe one can definitely deliver healthy returns and we have our task cut for that.

Please feel free to reach out to us if you have any queries / concerns.

Regards

Prescient Capital

Contact us: https://www.prescientcap.com/contactform

Investor Memo Nov 2021

Dear Investor, 

Hope you are doing well. 

Below is a chart depicting our performance viz baseline indices:

As of Nov 30, 2021

As of Nov 30, 2021

In this monthly update we will try and summarize the performance of our portfolio companies in Q2 and H1 FY 22.  The link to the summary table is as follows: 

Key observations are: 

  • Our portfolio has demonstrated a YoY sales and earnings growth of 21.6% and 12% respectively on a YoY basis for Q2 FY 22. The portfolio has demonstrated a YoY sales and earnings CAGR of 32% and 44% respectively in H1 FY 22. 

  • It is apparent from the data that the portfolio has seen margin pressure in Q2 FY 22. The same is attributed to a near decade high prices of input commodities such as Steel, Coal, Palm Oil, and the like. The choke around global shipping lines also ensured that the freight costs were also at an all time high. 

  • Compared to Q1 FY 22, ~ 50% our portfolio companies witnessed a reduction in EBITDA margin. 

  • Margin pressure was minimum in: 

    1. IT/ITES services businesses due to a strong demand

    2. Branded consumer goods/Branded pharma due to the company’s ability to pass on multiple price rises. 

    3. BFSI as interest rates harden and their book quality improves. 

  • Margin pressure was maximum in intermediate chemicals and businesses with a low dependence on own manufacturing. 

  • We would like to segregate the margin pressure in two categories: one where basic commodities are input. Second, where the input is not primarily a commodity but is dependent on a global supply chain. 

  • The pressure on margins in the former is transient as we see steel (corrected by 25% from peak), palm oil (corrected by 10% from peak), Crude Oil (corrected by 20% from peak).  We also see these businesses being able to pass cost inflation with a lag. 

  • The pressure in margins for the latter where the inputs are linked to a global supply chain looks more long term and is not expected to improve in the next 1 year. Our checks with experts running global manufacturing setups indicate that the current covid driven lock downs in China, Europe and Asia are likely to affect the supplies for at least one year. We therefore are closely looking at the intermediate product makers companies in our portfolio and exiting them selectively (Granules). 

  • At this moment we are confident that the margins of the companies in our portfolio will recover in the next 3-6 months. This confidence stems from a strong demand environment and a 5-6 year low inflation period in India. We believe that our portfolio companies have a strong MOAT (median ROE of ~ 20%) and can weather this high inflation environment.  

  • We are seeing a strong demand in the following segments and are aligning our portfolio to the following themes: 

    1. Auto ancillaries serving the upcoming EV industry (FEIM, NRB).

    2. Auto ancillaries serving the CNG commercial and passenger vehicles. The expansion of the CNG network in India is real and creating a trigger in demand for CNG driven PVs and CVs. 

    3. Banking sector has demonstrated resilience during COVID lockdowns. Demand for home loans, personal loans and corporate loans remains strong. We are investing in companies with a long term history of asset quality discipline and are available at the bottom percentile of the valuation.  (Can Fin, IDFC F)

    4. Domestic pharma has seen a strong demand post the second lockdown. The sector hasn’t run up in valuations. We are investing in branded pharma companies that specialize in chronic/acute segments. (Ajanta, JB, Alkem)

    5. Consumer durables and building materials have seen a sustained strong demand.  We are investing in companies that have a premium positioning and are backward integrated in mfg. (Hawkins) 

  • During the last 2 months, we also exited/pruned our positions in the following companies as we think that the trade-off between growth and returns is not favourable.  

    1. Mphasis: Initiated entry at a PE of ~ 19-20x and exited at a PE of ~ 45x. 

    2. Birlasoft: Initiated entry at a PE of ~ 12-20x and exited at a PE of ~ 30x. 

  • As a result of this churn in our portfolio, our portfolios median PE multiple has also reduced, refer below. 

As we enter the new year, two main topics look noteworthy: 

  • The global liquidity driven rally is at its fag end as inflation in developed world is making real returns negative. This is pushing regulators in these countries to increase bond yields. This is expected to lead to a drawdown of capital from equities to bonds. India still looks insular as GOI has controlled inflation well so far. Refer chart below: 

Source: Charlie Bilello

Secondly, some of you have spoken with us on how we see investing in the short to medium term. Please refer to our September 2021 memo for reference.  


Prescient Capital

Contact us: https://www.prescientcap.com/contactform

Investor memo Sept 2021

Dear Investor, 

Below is a chart detailing our model portfolio returns viz the leading indices. 

In this monthly memo we intend to discuss two broad topics: 

  1. Impact of Chinese real estate debt situation on India

  2. Macro indicators relevant for investing for the medium/long term in India. 

Impact of Chinese real estate debt situation on India

Real estate contributes to 25-30% of Chinese GDP. The recent clampdown by Chinese Community Party (CCP) on the home prices has sent the already levered balance sheets of Chinese real estate developers in a tailspin. Evergrande is just the beginning, the impact is systemic (stress up to 3-4% of GDP of China) and 10-15 large real estate companies are likely to face a cash flow crunch. Interestingly the first order impact of this debt crisis has been rather limited as a large part of the borrowing of these companies is domestic (>97% of borrowing of Evergrande is from Chinese Banks). What may be of interest from the overall slowdown of the real estate sector is the impact the same can have on the commodity prices. The Chinese real estate sector contributes ~25% of the global demand for iron and steel. The recent credit crunch may taper the demand and may soften the prices of Iron/Steel which have risen by >50% in the last one year. The Iron Ore price, which is a leading indicator of the future Steel price, has already sharply corrected by ~ 40% since July 2021.  This may be good news for Indian engineering/manufacturing companies that have seen their margins getting eroded in the last 6 months.  

The Indian real estate market has no correlation whatsoever with the Chinese real estate debt crisis. After the second COVID wave, the rebound in the Indian real estate market has been phenomenal. For the 9 M of FY22, the residential units sold are up YOY by 65% and the developers have also been able to pass on marginal price rise (1-4%). The overall demand is still hovering around 65-70% of the pre-COVID times though. Our discussions with managements of building material companies also indicate a strong rebound in demand. We typically don’t invest in real estate companies due to their poorly managed balance sheets and low returns on capital employed. We however like its derivative consumer facing businesses: building material and consumer durables. We have invested in SHIL in your portfolios. We believe that new project sales (40% of the sales contribution of SHIL) and pent up demand for building materials and durables (like cooktops, chimneys) should help SHIL grow at a CAGR of 15-20% for the next 2 years. 

Macro indicators relevant for investing for the medium/long term in India.

The regulatory risk around investing in China has increased post CCPs clampdown in real estate, ed-tech, media, and fin-tech. The same could help sustain the high FII capital flows seen by the Indian markets in the recent past.    

Given where the market valuations are, our investors and prospective clients have rightfully asked us this question: “Is it the right time to invest and are we in a Bubble?” As discussed with you in the last few memos, we wanted to discuss the same with some historical empirical data. We have picked up a table from a very well written memo by a peer PMS (Sage One September 2021 memo) to highlight some points: 

Source: SageOne Investor Memo September 2021.

Source: SageOne Investor Memo September 2021.

Key observations from the above are: 

  • Corporate India is in its prime financial health (better balance sheets and cash flow generation) in FY 21/22 when compared to the last 20 years. The Debt / Equity Ratio, an indicator of leverage on the balance sheet, is the lowest since FY 2000. To add to it, COVID has created a perfect supply/demand shock for a lot of sectors and hence improved working capital for the large/mid/small cap companies. This has helped companies accumulate significant cash. The Cash Flow from Ops/Profit After Tax (CFO/PAT) is a leading indicator of the same. 

  • Based on this data, we believe that we are at the beginning of a long capex cycle whereby companies would add capacities by using leverage. One could also argue that the Debt/ Equity ratio has been reducing systematically since FY 01. We would agree to that. However, almost all the manufacturing/engineering/oil & gas/chemical/utility/intermediate products companies we know and are tracking are adding large capacities. We therefore remain optimistic about the prospects of growth of earnings from a 4-5 years perspective. 

Source: BSE

Source: BSE

  • On the flip side, refer to the chart above: The PE multiple of the BSE 500 index is still high (October 2021 PE of 29.9x) even after correction from its all-time high of 38.8x in Feb 2021. It is fair to argue that the multiple is already factoring in this growth in earnings in the next 2-3 years. 

  • There are two main reasons why the current high multiples are holding up: 1.) The growth prospects of Corporate India over the next 4-5 years and 2.) the current low interest rates and high market liquidity. The G-Sec yields are a proxy for lending rates and are at an all-time low (of 6.2%). If we look at the last rally between FY 02-08, the bonds yields came down from ~ 10% to around 5.2%. This propelled capital infusion in the capital markets which returned an IRR of ~ 30% over the 6-year period. At present, RBI is comfortable with the inflation and has kept the policy rates intact. Events such as the slowdown of real estate in China, could help alleviate concerns around inflation and interest rate movement for a while. 

  • Worsening of the balance sheet quality of PSU/Pvt Banks could be a deterrent to the availability of leverage to corporate India. The same happened during the 2013-2016 period (refer charts below) during which the banking credit wasn’t available. 

  • PSU Banks are the engine of corporate lending and from what we understand from their managements’ reports is that PSU Banks have sorted their asset quality concerns and are back to lending to corporates/SMEs. To our understanding, the overall banking sector has weathered the COVID lockdown well and their asset quality has been marginally impacted. 

Source: BSE

Source: BSE

Source: BSE

Source: BSE

  • Given the background of A) Anticipation of high growth from Corporate India, B) Recovering credit markets, C) High valuation multiples, it is imperative that we continue to invest albeit conservatively. We are investing in companies where the trade-off between growth and valuation is not stacked against us. We would like to highlight the PE multiple of our model-portfolio viz the index.  

Picture 6.png
  • It can be observed and commented upon that the gap between the index and our model portfolio valuations is narrowing over time. We attribute the same to two things: 

    • The higher growth prospects offered by our portfolio viz the index has increased the valuation multiples of the portfolio companies. The valuations are still not at the alarming levels though. 

    • We are at the cusp of exiting from a few companies that have done exceedingly well for us in the recent past however now look rich when we analyze from the framework of trade-off between growth and valuation. The portfolio’s PE multiple should ideally come down over the next 2-3 quarters as we exit these companies. 

  • To summarize: We are safeguarding your returns by exiting companies in our portfolio that are at the peak percentile of their valuation multiples. We are redeploying the same capital gradually in new companies at fair/conservative valuation multiples. This will help us to tide well over this period of peaking markets. 

  • The sectors where we are deploying capital at present are cement, building materials, auto ancillaries and banking services. 

Prescient Capital

Contact us: https://www.prescientcap.com/contactform

Prescient Capital - August 2021- Investor Memo

Dear Investors, 

Below is our performance benchmarked to major Indices. 

NOTE: As of Sept 06, 2021

NOTE: As of Sept 06, 2021

After several months of posting strong sequential returns, the small cap space was flattish for the month of August 2021. The benchmark smallcap index BSE Smallcap is flat for the month but does not reflect the correction in the majority of smallcap stocks in the broader market. Since our strategy has a lion’s share of allocation to small and midcap stocks, it is natural for us to turn cautious and introspect on how we should handle a sharp correction or the onset of a bear market in the worst case. The past 1.5 years or so have been great for the equity markets and we have also benefited from the broad rally in equities. However, it is important for us to not only protect our past returns but generate healthy absolute returns from hereon. Over the last 2-3 months we have been reducing our stake in companies where the trade-off between growth and valuation is unfavorable.  Over our long investing career, we have witnessed several market cycles and our experience and mistakes have taught us some key learnings from what we have seen working successfully in a bear market:

  •  The most important thing is to remain patient and not get scared by the correction. One should remember that a bear market is actually an opportunity and outsized returns can only be made if one remains invested / initiates investment in differentiated and durable businesses during a bear market. Whenever the cycle turns, the peak of the next bull market is always much higher than that for the previous bull market. Even the bull market in equities that started in April 2020 had its beginning in a very sharp market correction of over 30% during Feb-March 2020. The longest and most rewarding bull market of 2003-08 in Indian equities had its beginning in a very severe bear market of 2001-03. Similarly, the huge rally in small and midcap stocks over 2014-2017 had its beginning in the bear phase in small and midcap stocks over 2010-13. Exceptional equity returns cannot be made without enduring some pain during a bear market phase.

  • Several prospective clients ask us if now is a good time to enter the market since returns have been so high. Our answer is always that the best time to start investing is immediately because we have seen that it is impossible to time the market. The only caveat we clearly mention is that we believe investing is for the long term and one needs to remain invested at least 2-3 years especially to reap the benefits of a medium to long term focused fundamentals strategy like ours. It is impossible for anyone to predict the onset of a bear market and fully exit before it and similarly predict the start of a bull market and invest meaningfully then. Just as an example, we believe very few investors would have predicted the sharp and quick correction during Feb-March 2020 and exited immediately to enter subsequently in June-July 2020 when the rally started. What we saw was that investors who panicked and sold out during the crash of March 2020 were never able to meaningfully enter the market until much later thus missing out on a large part of the huge rally especially in small and midcap stocks. Anchoring bias of having seen stocks at much lower levels and fear that the rally is unsustainable made it impossible for such investors to enter until they missed out on a substantial portion of returns. On the other hand, investors who invested with us in 2019 much before the crash of March 2020 and remain invested during that painful phase went on to enjoy very handsome returns on their invested corpus despite suffering sharp correction (drawdown of ~ 18%) in the interim. So, a key learning for us during times of correction or a bear phase is to not try to predict the bottom and time your market entry but initiate investing or remain invested. Time spent in the market is always more important than time of market entry / exit.

  • One should not fear corrections during a bear phase. However, one should also not be completely passive. It is a fact that every bull market rally is clearly led by a new sector, and it is seldom the case that different bull markets have common sector leaders. So, during a bear phase, it is very important to evaluate one’s portfolio and determine which investments will do well and correct less during the bear phase and subsequently lead when the cycle reverses. We have a strong focus on evaluating industry fundamentals in our investment framework and we only invest in companies from sectors that we believe will enjoy strong tailwinds during our investment horizon. Even once we are invested, we continuously track industry developments to check which industries are doing well as per our expectation and which are not. We are very objective in exiting industries that are facing challenges and increasing allocation in industries that are doing well. This disciplined method of force ranking industry prospects becomes even more important in a bear phase as it is important to exit industries which will come under stress during a bear phase and increase allocation to industries that are poised to do well and lead when cycle reverses. We did this during the correction of March 2020 when we increased allocation to sectors like IT and pharma that witnessed relatively lesser correction and then initiated the market recovery. We continued to track and evaluate which sectors will do well subsequently and later on rotated into sectors like auto and cement that started outperforming during the later phase of the current market rally.

  • Lastly, we believe it is important to stick to one’s investment framework during a bear phase. It is natural to start doubting one’s investment philosophy when one witnesses a sharp correction. However, it is critical to remember that such corrections are majorly driven by temporary market factors such as sharp drop in liquidity, extreme fear among investors, etc rather than by business fundamentals. It is important to separate the business performance from the stock price performance and continue to follow one’s investment process. For us, we try to maintain the discipline of only investing in high quality businesses run by honest and competent management. During sharp corrections, we try to maintain our calm and avoid jumping to other investment philosophies like only investing in large caps just because they are perceived to be better businesses, investing in stocks that have fallen the most and seemingly offer great value despite poor business fundamentals, investing concentratedly in sectors that led the past bull market, etc. We have seen that changing one’s framework during a bear phase can lead to disastrous results.

While we think it is too early to say that the volatility in August is the start of a bear phase, we believe we should be able to handle and in fact take advantage of a possible bear phase by following our learnings from previous bear markets.

Please feel free to reach out to us if you have any questions.

Prescientcap Investment Advisors

https://www.prescientcap.com/contactform

Prescient Capital - July 2021 - Investor Memo

Dear Investors, 

Hope you and your family are holding up fine. 

Below is our performance viz benchmark indices: 

Actual Returns .png

In this update we will talk about two topics that some of you have raised in your formal and informal discussions with us: 


Topic 1: Investing in IPOs.

We are very excited by the quality of founder/promoters and the companies that are getting listed recently. Especially, some of the tech companies that have filed for their IPOs (Zomato, Nazara, Nykaa, Paytm, Policy Bazaar and Car Trade etc) are unique businesses that we have previously seen as private deals. At Prescient, we have often thought about investing in US tech stocks (for eg: Amazon, Google, Microsoft, Zoom) as these are high growth, sticky businesses with very strong MOATs. These Indian tech IPOs now offer us a more meaningful opportunity to invest in tech businesses given our experience of Indian equity investing help us better track these. 

However, the valuations of IPOs in the last 2 years have been expensive to say the least. The chart below summarizes the valuations of companies that have IPOed since 2019:

Average Listing PE

At such valuations, there is more room for downside (due to a macro correction or a bad quarter in a company’s performance). This also puts undue pressure on promoters to generate returns for incoming institutional investors and may trigger a vicious loop for the company. We have often seen businesses not able to match their pre-listing performance for 1-2 years post their listing.  

Our criteria for investing is such companies are as follows: 

  • Thorough diligence on the promoters: Due to their limited public track record, more time needs to be spent on the governance track record of the founders/promoters. Collection of both subjective and quantitative data on these promoters becomes critical. As a part of our diligence on these companies, we speak with funds/investors who have been with these companies for the longer term and understand the promoter’s motivation reasonably well. 

  • Amongst the tech businesses, we like those that spend more capital on customer retention/product R&D than on pure customer acquisition. Platform businesses built with such R&D and customer centricity have very high customer retention. 

  • We stay away from valuing on Price to Sales or Price to GMV multiples and work hard to model some sort of future profitability and cash flows and then value on forward  P/E or Price to Cash Flow multiple. Given that a lot of value of such businesses is from its high growth trajectory, we focus on the sustainability of the high growth of these businesses 2-3 years hence. We like to invest in business closer to a PEG (Price to Growth multiple) of 1x. 

  • If we can’t invest at the time of IPO, we wait for good quality companies to correct reasonably due to market correction or a temporary blip in their performance. We believe that good companies provide you with a narrow window of opportunity to get in and hence our work should be done before this correction. We have built partial positions in the companies in our portfolio post their corrections. 

    1. Heranba: Initiated purchase at a P/E multiple of 19x when the stock corrected by ~ 25% post its listing in Feb 2021

    2. Mrs Bector Foods: Initiated purchase at a P/E of 31x when the stock corrected by ~ 45% post its listing in Dec 2020

    3. Nazara: Initiated a position at a correction of ~25% post its listing in March 2021.    

  • Our balance position gets built based on the performance of these companies or on a sharp correction in the markets. 

Topic 2: Portfolio Construct

The second topic we want to discuss today is the construct of our portfolio. A lot of you have often asked us if it is a good time to invest/invest more given the valuation for the index. We would like to answer this by highlighting that we are bottoms-up investors and are very conservative on valuation. As long as we find investable companies in their bottom 20-30% percentile valuation, we will continue to invest. The chart below highlights our model portfolio PE multiple and compares the same to the PE of the BSE Sensex. 

Median Portfolio PE and BSE Index PE Multiple-3-2.png

Key comments we want to make are: 

  1. We typically take 6-9 months to fully deploy your capital. This period factors in any up/down movement in the market. Due to our conservative pace of investment, our older client accounts were 40-60% invested before the March 2020 correction. Our deployment was maximum during the March 2020 quarter when the valuations were at their rock bottom. The availability of cash helped us invest the capital at the right valuation when the time came in March 2020. We believe that small/big corrections are part of the course of this deployment cycle.  

  2. If you see our portfolio PE multiple, we have always stayed conservative even when compared to the BSE Index. Individual companies in our portfolio have been selected at conservative valuation. Staying conservative on valuation always gives us a headroom for returns and multiple expansion even when the markets are peaking. If you see the chart above, post March 2021, the index PE has shrunk by ~ 12% whereas our portfolio PE has expanded by ~5%. 

  3. As we see things today, we are actively selling companies in our portfolio that are richly valued (>30-40x PE depending on the sector) and do not have promising growth prospects in the next 1-2 years. These names are replaced by well managed companies that are reasonably valued and have better growth prospects for the near term. You would also see that our median portfolio PE has reduced between June 2021 and now. This is the numerical evidence of this portfolio churn we are undertaking. 

  4. In case you invest in other PMSes or funds, a metric that you can track and compare is the portfolio PE. A low portfolio PE compared to index / market PE helps protect the downside of your portfolio during market corrections. When we started in the Oct-Dec 2019 period, our portfolio PE was 15x compared to a PE of 26x for the index. During the March 2020 correction, the index corrected by 31% compared to a correction of 20% in our portfolio’s valuations.  


Regards,

Prescient Capital

Contact us: https://www.prescientcap.com/contactform