Dear Investors,
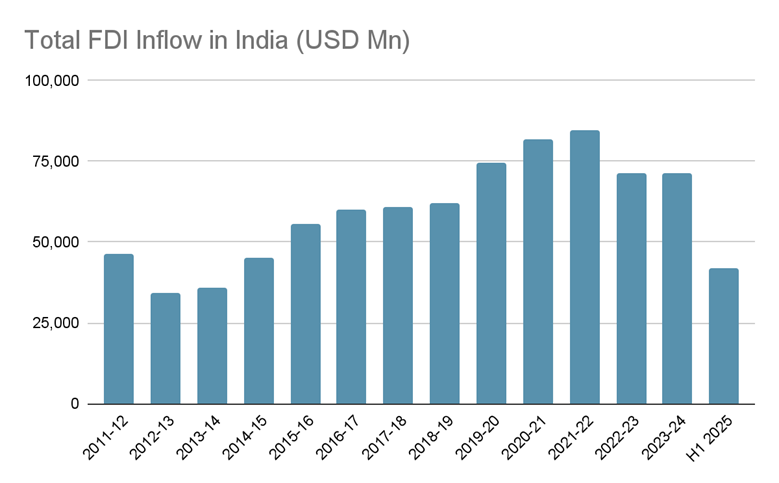
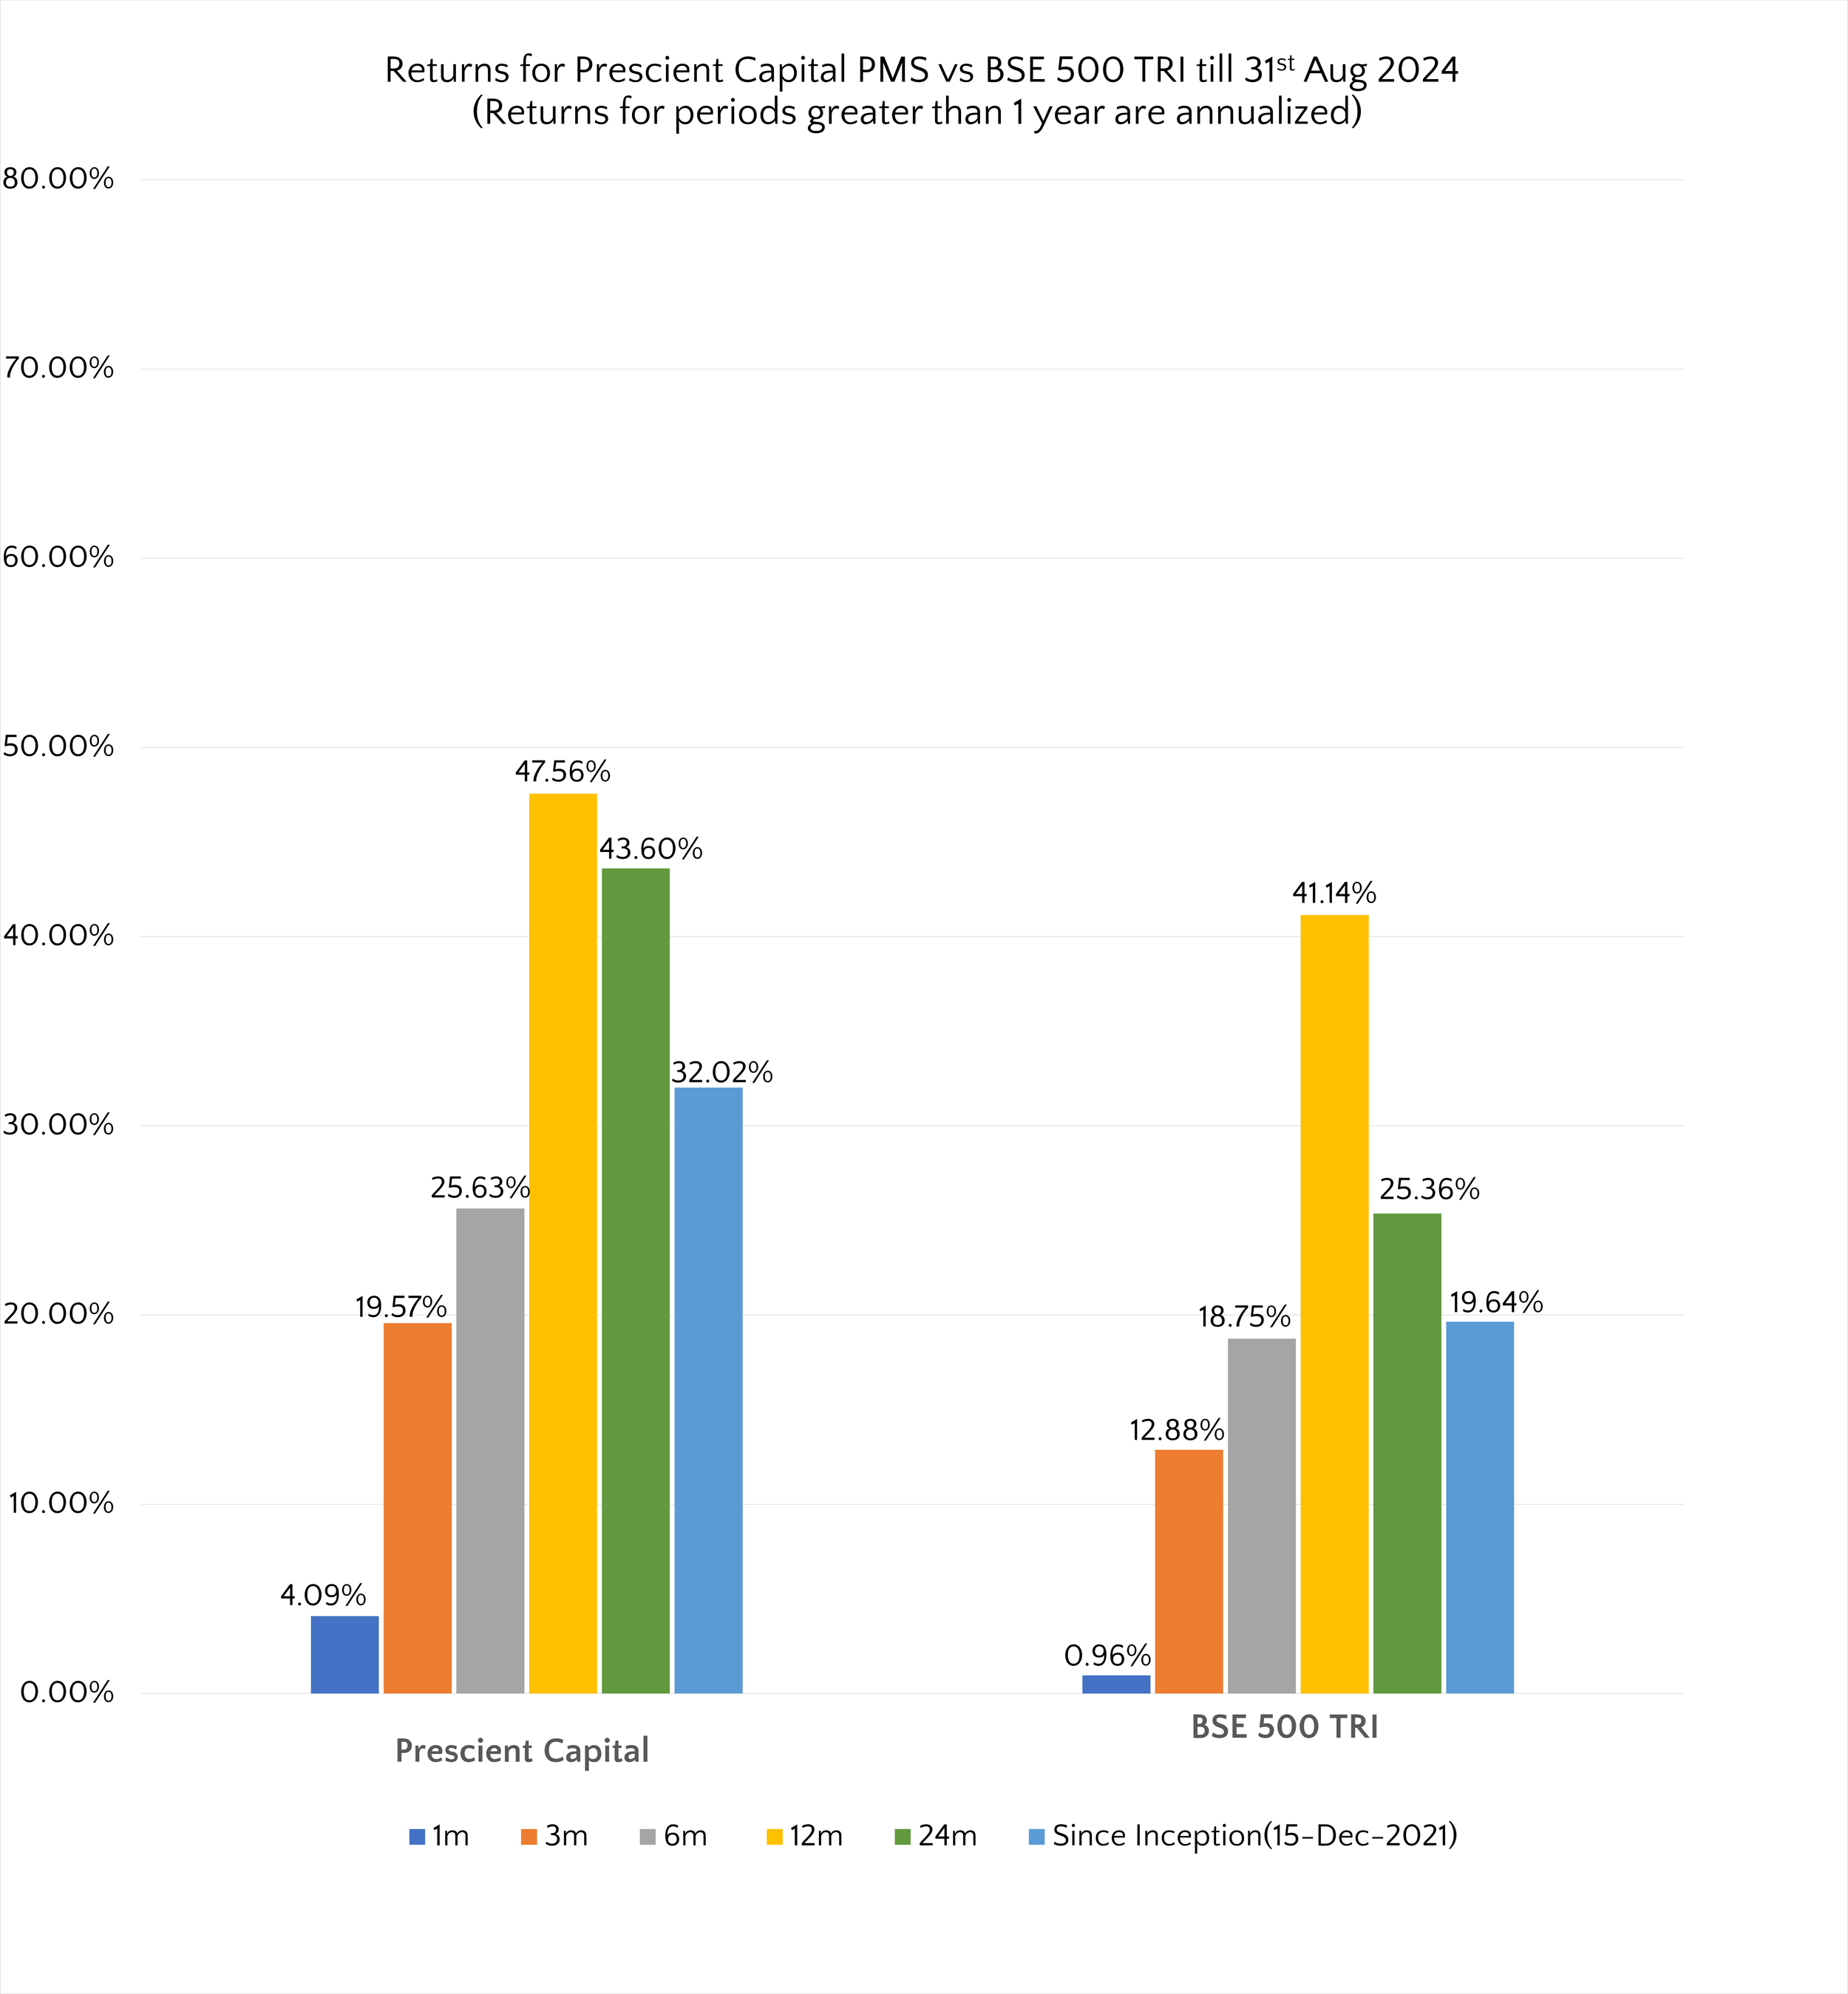
The following chart depicts our returns viz BSE 500 TRI:

In this month’s memo, we will discuss why our PMS product is focused on investing in a portfolio of high quality small and mid cap companies rather than investing in large caps. Since Jan 2025, there has been substantially higher correction in small and mid cap companies compared to large cap companies (refer table below). Also, the investor sentiment towards small cap investing has turned quite negative with leaders in the fund management industry like Sankaran Naren, CIO of ICICI Prudential MF, calling out the high valuations and risks of continuing to remain invested in small and mid cap companies. Several other respected fund managers have also called out the risk in small cap companies citing overvaluation in this space.

*till 27th Feb 2025
We highly respect these fund managers and concur with their view that in a broad sense small and mid cap companies are on average overvalued. However, we do not agree with their view that one should completely exit small and mid cap companies. Below we will share key reasons why we have high conviction and continue to remain invested in small and mid cap companies:
As per SEBI definition, large cap companies are the top 100 Indian listed companies by market cap. We believe this set of 100 large cap companies is too restrictive as they don’t adequately represent several niche sectors like building materials (tiles, sanitaryware, plywood, etc and not cement), auto ancillaries, industrial consumables, consumer durables, renewables, etc. At any point of time in the market, there are always fast-growing businesses in niche sectors, and we see our job as a portfolio manager is to identify and invest in these. Our entire cumulative investing experience of 25 years+ has been spent in identifying and patiently remaining invested in niche well run small cap companies bought at attractive valuations. Our investment journey has taught us that small cap space is volatile and goes through painful corrections, but if you maintain the discipline of patient long term investing and good stock selection, the returns are healthy over the long term.
As on Feb 27 2025, the market cap of the smallest large cap (i.e. 100th listed Indian company by market cap) is INR 86,501 (roughly USD 10 Bn). We find it difficult to believe that a portfolio of 15-20 large cap Indian companies can deliver an IRR of 18-20% over the next decade given their huge current market caps. It is very much possible that 2-3 large cap companies can deliver an IRR of 20% or higher over the next decade but our product offering is a portfolio of 15-20 listed companies. Our aim is that the portfolio delivers an IRR of 18-20% (net of fees, which makes the Gross IRR requirement even higher) over a longer time period of 5 years+.
Our thought process is that a portfolio of 15-20 Indian large cap companies (required hit rate of 15-20%as there are only 100 large cap companies) cannot compound at such high rates, especially given that Indian large caps are not technology disruptors like the magnificent 7 in US (Alphabet, Amazon, Apple, Meta Platforms, Microsoft, NVIDIA, and Tesla). So, if we aim to deliver a 18-20% net IRR to our clients over the long-term horizon of 5 years+, we believe we must look beyond the large cap space to identify small, niche businesses run by outstanding promoters growing at a high rate.
Below is the performance of Indian small cap and large cap MFs over the last decade:

As can be seen from the table above, Indian small cap MFs have comprehensively beaten the returns of large cap MFs. There is no reason to believe that the performance in the upcoming decade will be any different. In fact, the last decade has seen several events that were more challenging to smaller scale businesses like demonetisation, GST implementation, NBFC crisis, Covid-19, etc. Despite these challenges, small cap MFs have been able to deliver much higher returns than large cap MFs. In fact, past decade’s performance shows the kind of return that we target to generate (18-20% IRR net of fees) over long time horizon can only be made in the small cap space.
The chart below shows the performance of the BSE Smallcap index over the past decade.

During the last decade, there have been 3 instances when the index has corrected by 20% from previous all-time highs. Any correction of more than 20% is when an index enters a bear phase:
A very brief phase during Feb 2016 when the index was down more than 20% from top but recovered very quickly.
A very prolonged period over June 2018 to Nov 2020 when the index was in a bear phase (20% or more correction from the previous high). In fact, the index corrected by ~55% from its previous all-time high at its bottom point in March 2020.
The current ongoing correction when the index has gone down by more than 20% and entered a bear phase on 14th February 2025.
Despite these severe drawdowns in the small cap space, the median return CAGR delivered by small cap MFs over the past decade is a healthy 16.5%, which is higher than the return delivered by the best performing large cap MF.
Lastly, we get questioned by clients why we did not tactically exit our small cap positions back in September or October last year and either deployed that in large cap companies or held cash for a better buying point. This seems to be a prudent step in hindsight, especially given we were aware that overall small caps on average had become expensive and had been pointing out the same in our monthly updates. Our response to that is we do not try to time the market in our investment process. We are bottom-up investors, and we evaluate each investment position for its own merit at any point of time. Each new investment we make is bought at an attractive valuation for the next 3-5 years. Similarly, we exit positions whose valuations run up so quickly that we see no healthy incremental IRR over the next 3 years.
We will never take an overall cash call to sell half or entire of the portfolio based on our sense of market valuation. We will sell individual positions if we feel they have become overvalued, which is what we did when we exited completely or partially our positions in TD Power, RPG Life Sciences, Ajanta Pharma, Bharat Bijlee, Gabriel India, Kirloskar Oil Engines, JB Chemicals, etc in older portfolios last year. Similarly, in newer portfolios for clients that onboarded us last year, we were investing in attractively valued opportunities in a staggered manner. Overall, we had decent amount of cash (15-20% of overall PMS AUM) in October 2024 when the market peaked. However, we did not take a call to sell half or exit fully all our existing positions or stop searching for new investment opportunities. That would have been market timing, which is something we don’t do.
Please feel free to reach out to us if you have any questions / concerns.
Regards,
Prescient Capital