Dear Investors,
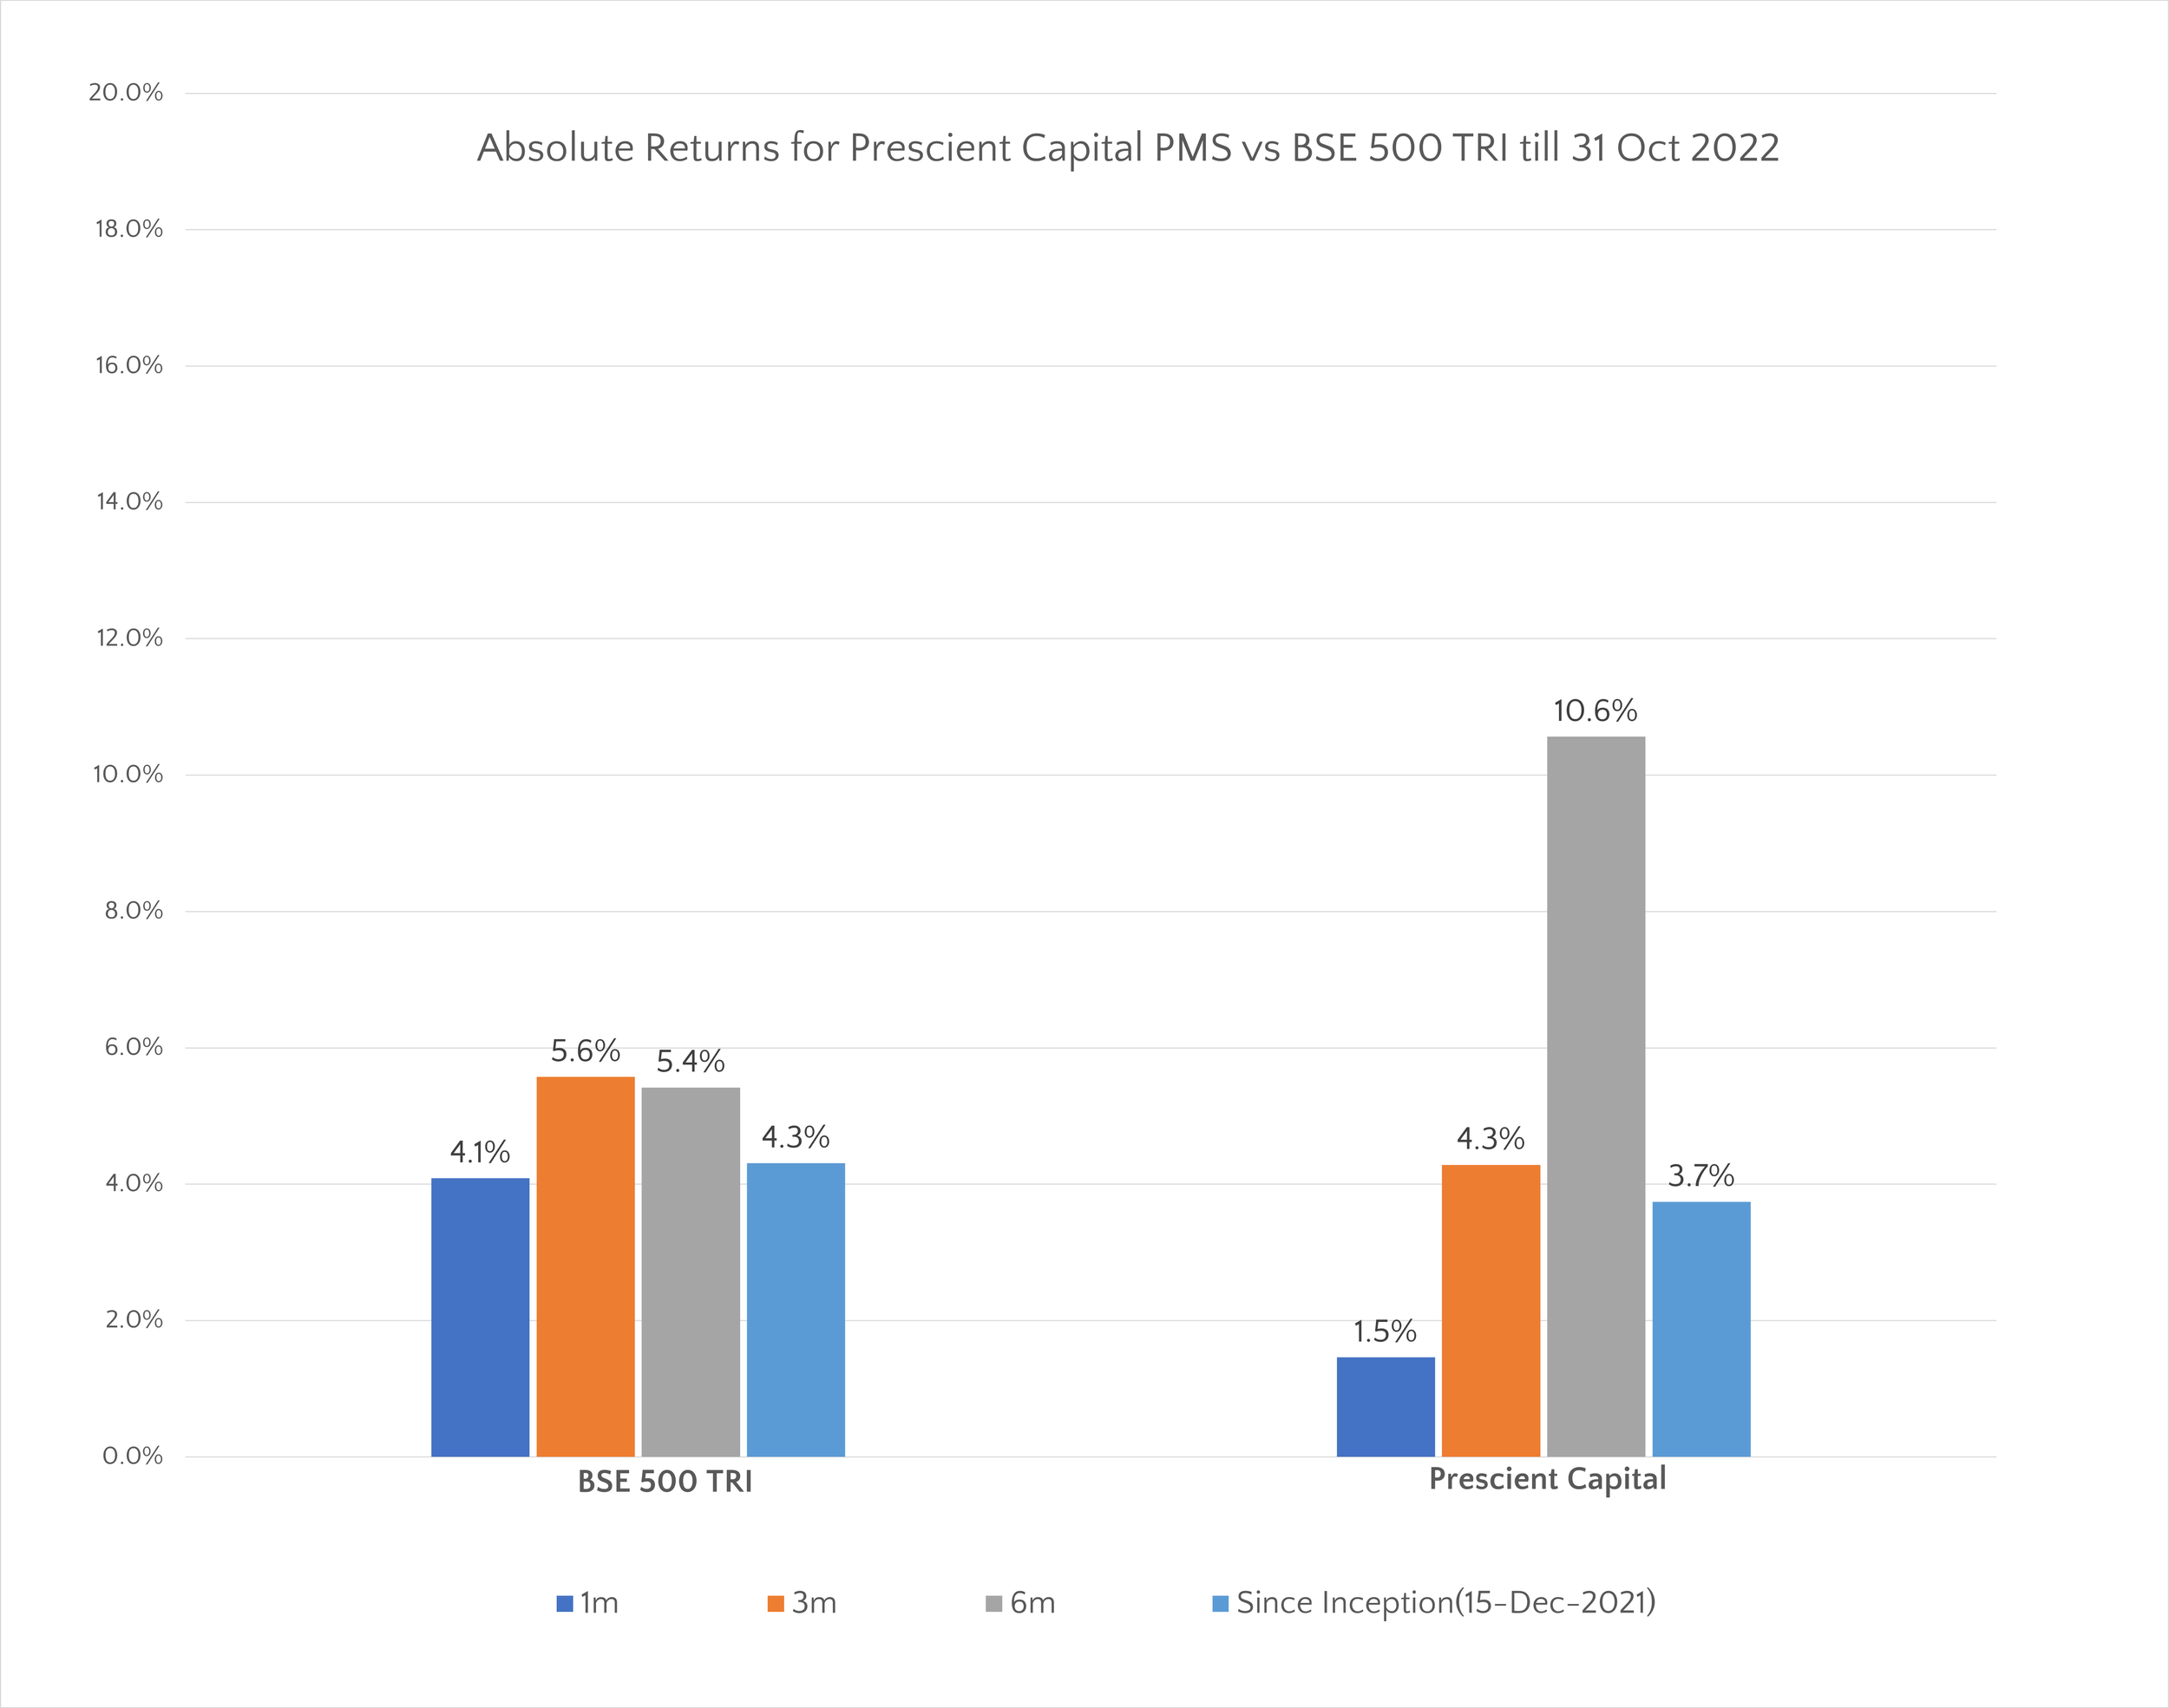
The following chart depicts our returns viz BSE 500 TRI:

In this month’s update, we discuss our approach of tackling the frothy valuations in small cap stocks. Since we are mainly a smallcap investment strategy, our investors may be concerned whether small caps stocks have peaked out and are poised for an imminent correction.
Valuations of small cap stocks are at an all-time high, and it is very highly likely that returns will be muted over the next 1-2 years. However, we don’t think it means this is the time to exit or not initiate investments in small cap stocks. We don’t believe it is possible to time the market and sitting out will lead to missing opportunities that may not deliver in the near term but will deliver outsized returns when the next bull phase starts, the timing of which no one can predict.
Our investment approach is a bottom up one in that we work to identify good quality businesses run by honest and driven management at attractive valuations. All 3 aspects: Business quality, attractive valuation and stellar management are equally important, and we don’t compromise on one. In times of stretched valuations like current, we find it hard to invest in reasonably valued opportunities so naturally our rate of capital deployment for new client accounts slows down. However, we won’t recommend new investors to sit out as markets are volatile and can correct substantially on any given day thus giving us the opportunity to deploy capital. For e.g., the small cap indices corrected by more than 10% over 1st-13th March while individual small cap stocks corrected by 25-30%. We had cash in all our client accounts that we invested to take advantage of the corrected prices. Moreover, as we mentioned in our earlier updates, we have been exiting stocks with stretched valuations in our portfolio. So, our valuation conscious approach takes care of frothy market situations like the current one.
However, we will not take an overall cash call to liquidate investments to reach a certain cash level like 25% of portfolio value. We have consistently communicated that we don’t time the market as we believe it is impossible to do so in a manner that can create meaningful alpha consistently over time. So, we will not disinvest client portfolios just because the market has reached a certain level, or the past 12 months return has been outsized. The problem with this approach is that it is impossible to exactly time your exit and re-entry. For e.g, the BSE Smallcap index has been appreciating since April 2023 and small cap valuations started to turn expensive back in July August last year. So, objectively one should have exited his/her investments at that time only. If one had done that then he/she would have missed ~20% appreciation from those levels even after the recent correction in March.
Moreover, there is no clear rule as to when one should re-enter the market. Should we re-enter after a 15%, 25% or even larger correction? There is no guarantee that when the market, as represented by a benchmark index, will correct to that level. Also, tracking an index in this way will make us miss many good growing businesses during this period of sitting out. Valuation is just one aspect of the investing framework; earnings growth is an equally important one. Good companies with growing earnings catch up to their expensive valuations. So, just to reiterate, we don’t take cash calls depending on macro factors or indices hitting certain levels. It is a bottom-up call for us whether an existing investment has become too expensive to hold or a good business is available at a reasonable enough valuation to buy.
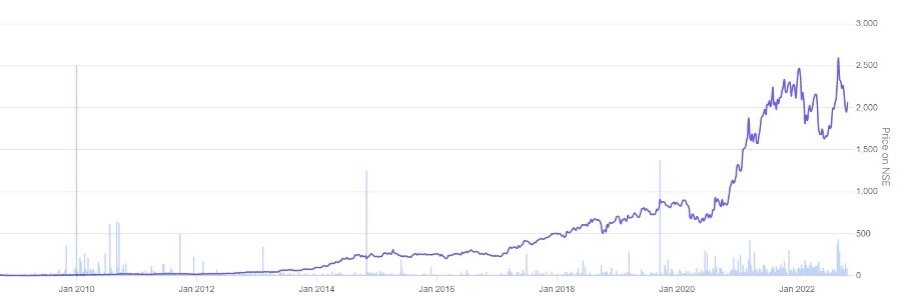
Just as an exercise, we wanted to see how market timing has performed historically. We used the S&P 500 as the benchmark index as we wanted a trading history of at least 50 years to have enough data points. Below is the S&P 500 chart for past 50 years

To evaluate the upside from trying to time the market, we compared the returns generated by 2 sets of investors over the last 50 years. The first investor group only invests when the S&P 500 hits an all-time high. There will be multiple instances when the S&P 500 would have hit an all-time high over the last 50 years. The table below shows the median, min and max of the 1 year, 3 years, 5 years and 10 years returns (CAGR in case of periods more than 1 year) if one invested at all-time high points of S&P 500 over past 50 years:

The second investor group only invests when the S&P 500 corrects by 20% or more from previous all-time high over the last 50 years. The table below shows the median, min and max of the 1 year, 3 years, 5 years and 10 years returns (CAGR in case of periods more than 1 year) if one invested at all-time high points of S&P 500 over past 50 years:

The approach of the first investor group can be viewed as aggressive as they invest only at market highs. On the other hand, the second group is clearly timing the market and only invests when the S&P 500 has corrected by a substantial amount of 20% or more. However, there is no material difference in the returns generated by the 2 different approaches. In fact, the median returns generated by the all-time high investing approach are somewhat higher than the return generated by the market timing approach across all periods. This can be explained by the fact that in equities, the bull phases last much longer than bear phases.
For example, the bull cycle of US equities (one can look at NADAQ or S&P 500) that started in mid-2009 lasted till March 2020. During this period, the S&P 500 did not witness even a single correction of 20% or more. The bull cycle ended with a sharp and quick correction in global equities when Covid-19 pandemic broke out in March 2020. As equities reflect how well an economy and hence businesses are doing, it makes sense that bull phases last much longer than bear phases as economies (or per capita GDP) expand over time.
A key risk of exiting the market or stopping follow-on or new investment in equities at market highs is that it is not known how long a bull phase will last. More so for an economy like India that is expected to keep growing at 6-7% real rates over next 25-30 years. So, how does one know that the current market high is not a part of 10-year or longer bull phase of Indian equities? Staying out of Indian equities during such a phase will lead to missing out on an exceptional wealth creation opportunity. This is not to suggest at all that Indian equities will move in a linear upward fashion. That will be a nightmare for valuation conscious investors like us as we will find it very difficult to invest in reasonably priced opportunities. In fact, equities are volatile by nature, especially small cap stocks due to their low institutional ownership and thus will keep correcting from time to time. This will give us an opportunity to invest during corrections for patient investors like us.
Just reiterating the key takeaway from this, we agree that valuations of Indian small cap stocks are stretched, and we have become more cautious in making new investments as well as are exiting expensive invested positions. However, we don’t believe market timing moves like taking portfolio level cash calls, sitting out of the market and waiting for corrections to top up or initiate equity investments are the way to respond to expensive market levels.
Regards,
Prescient Capital