Dear Investor,
The chart below compares our monthly returns viz leading index BSE 500.

Equity markets including Indian equities have been very volatile since Oct 2021 (almost for 1.5 years now) and have delivered negative to flat returns. All of our clients have been very patient in remaining invested and have even deployed incremental capital to take advantage of this correction. However, a valid concern / question in everyone’s mind is whether the market has corrected enough to form a bottom and can be reasonably expected to rebound from here on. It is an extremely tough question to answer because it depends on a lot of factors like macros improving from here on (inflation falling sustainably and consequently interest rates topping out), relative attractiveness of Indian equities to other markets, investor outlook regarding prospects of equity as an investment option especially that of FIIs, etc.
Overall, our sense is that markets are fairly valued at present and future returns will be broadly determined by earnings growth. This is mainly true for large and mid cap companies, but the small cap space has corrected significantly and offers attractive opportunities. We have repeatedly stated in the past that small cap space is more volatile due to factors like low institutional ownership, low liquidity, higher concentration of low-quality businesses / management, etc. However, good stock picking based on thorough due diligence of business and management quality and business prospects combined with conservative entry valuations can lead to significant alpha creation. We believe the correction in the small cap space presents an attractive opportunity to invest in high quality businesses at attractive valuations for the long term.
As we start a new financial year, we present some interesting data points on the current state of market:
Market cap to GDP ratio
India’s market cap to GDP ratio is currently at 94% compared to a 10 year mean of ~88%. India is at a steep discount to the US while it is at a premium to China and emerging markets like Brazil, Russia, etc. This has always been the case historically and can be explained by the constitution of the different equity markets. US market cap is heavily dominated by tech giants like Apple, Microsoft, Amazon, etc and has the highest RoE among all equity markets globally. Indian markets are somewhere in the middle in terms of RoE and have a healthy mix of companies from high RoE sectors like IT Services, FMCG, healthcare, etc to commodity and highly regulated businesses like banking, metals, oil & gas, etc. Most emerging markets like Brazil, Russia, etc have a high concentration of highly regulated and commodity industries like metals, mining, govt. owned banks, etc leading to lower valuations. Chinese equity market valuations have derated since 2012, when Xi Jingping assumed leadership of China, and the derating has only accelerated since 2020 due to increasing perception of China becoming more opaque in sharing of economic and social data, tighter regulation of businesses, etc.

The chart below compares the current market cap to GDP ratio for Indian equities to the historical levels. As can be seen, the current situation is not as attractive as March 2020, when the markets corrected sharply due to fear of impact of Covid-19, or late 2008 during the global financial crisis. So, we cannot expect a strong rebound like 50% or higher gains in benchmark indices over next ~2 years from current levels. However, the chances of a sharp correction from current levels also appear quite low.

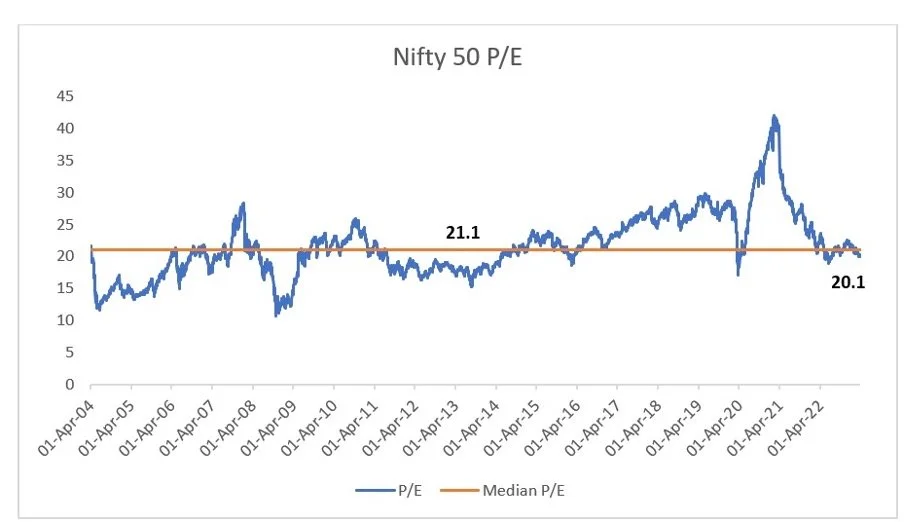
Current valuation
As can be seen from the chart below, Nifty 50 is trading close to its 20 year median valuation, which indicates fair valuation.
However, the broader markets (represented by Nifty 500) and especially the small cap space (represented by Nifty Smallcap 100) has underperformed Nifty 50 by a large margin over the last 1 year, 2 and 5 years time frame.
Performance of different indices as on 30th March 2023 end

We believe the underperformance of smallcap stocks v/s large cap stocks should mean revert in future. The key is to be invested in high quality small cap businesses that are sector leaders in their small and niche markets and are run by honest, competent and driven management teams. Historically Indian equities have created the largest number of multi baggers (10x or higher return in 10 years) amongst all equity markets globally (see chart below). In a previous update, we had discussed the reasons as to why Indian small cap space offers investors an opportunity to make VC type returns while taking much lower risks. Indian equity markets are most conducive for active stock picking due to factors like availability of listed businesses early in their life cycle, leadership of niche market spaces, low risk due to proven business viability unlike most VC funded unlisted businesses that pursue growth over profitability, etc.

All asset classes are cyclical in nature
Typically most investors believe that equities are more cyclical and volatile in nature whereas other assets like gold, real estate, etc have secular and predictable returns. Nothing could be farther from the truth as all asset classes are cyclical and deliver poor or no returns over long time periods. Case in point is the performance of gold price in $ historically as shown in the chart below. Real estate also suffers from similar cyclicality though we could not find a chart to highlight that as real estate is not standardized product like gold (has many different micro markets).

Overall, we want to emphasise the importance of being patient and systematic in equity investment approach despite short term volatility. As per the S&P 500 historical data since 1926, the possibility of positive returns increases from 63% over 1 month holding period to ~95% over 10 year holding period.
Please feel free to reach out if you have any queries / concerns.
Thanks & Regards
Prescient Capital